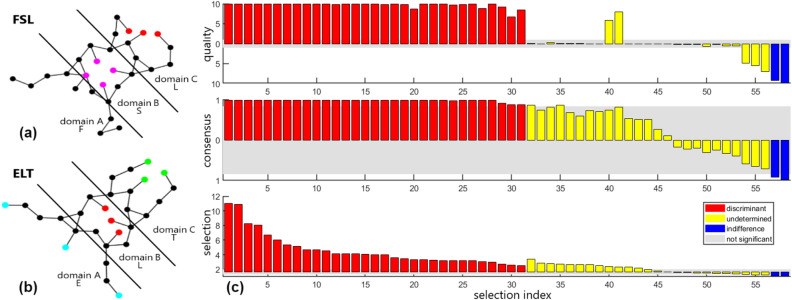
Figure 4.
Discriminant analysis on synthetic molecules. (a) The synthetic molecule FSL indicates Free-Square-Linear geometric signatures are present within domains A, B, and C respectively. Free indicates no restraining forces are applied in that region. (b) The synthetic molecule ELT indicates Extended-Linear-Triangular geometrical signatures within domains A, B, and C respectively. The extended structure emulates a pose for binding to a receptor. (c) The vector space is partitioned into (discriminant, undetermined, indifferent) subspaces, spanned by (d-modes, u-modes, i-modes) shown in bar-graphs, colored as (red, yellow, blue). The decision triad criteria are shown as stacked bar graphs with selection (bottom) corresponding to the signal-to-noise scoring function that rank-orders the modes within each subspace separately, consensus (middle) and quality (top). Consensus and quality values are plotted (above, below) the 0-reference line when selection is (above, below) the bifurcation reference. Gray background shows the decision triad acceptance thresholds. As an output from SPLOC-RNN, the stacked bar graph format highlights the characteristic strengths and weaknesses of each mode.

