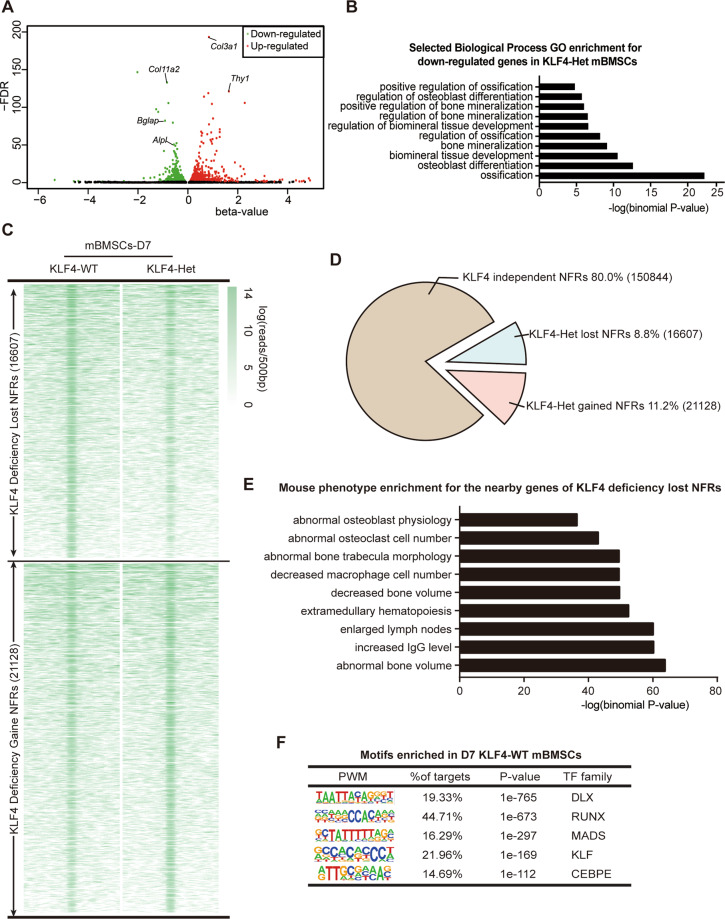
Fig. 6. Genomewide profile of KLF4-dependent genes and open chromatin landscape in osteoblast differentiation.
A Volcano plots of RNA-seq data, showing the genes up- or downregulated in KLF4-Het osteogenic medium induced primarily-cultured mBMSCs. Green dots indicated the downregulated genes. Red dots indicated the upregulated genes. n = 3. B GO enrichment of RNA-seq data for the downregulated genes in KLF4-Het osteogenic medium induced primarily-cultured mBMSCs revealed in RNA-seq profiles. C NFR summit-centred heat map of ATAC-seq signals in KLF4-WT and KLF4-Het cells. n = 3. D Pie chart showing the distribution of all 188,579 NFRs relative to gain and loss with deficiency of KLF4. E Mouse phenotype enrichment assay for the nearby genes of Klf4 deficiency lost NFRs revealed in ATAC-seq profiles. F Top five enriched motifs in deletion of Klf4 lost NFRs. PWM position weighted matrix, TF transcription factors.

