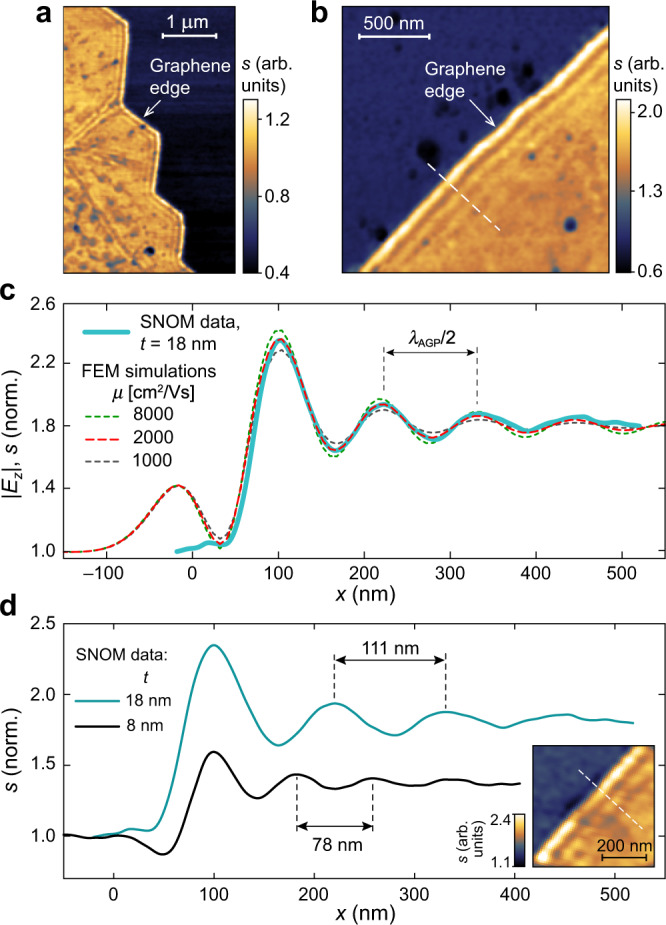
Fig. 2. Near-field mapping of the AGP interference fringes at the graphene edge.

a Distribution of the near-field signal intensity s(x,y) over the doped graphene near its edge, where the AGP interference fringes are visible. b High resolution s(x,y) scan of the graphene edge with AGP interference fringes. c Near-field signal intensity (blue solid) measured across the edge shown in (b) along the white dashed line (averaged over a ten-pixels-wide line), and calculated |Ez | at different carrier mobility in graphene (dashed) with EF = −0.51 eV. d AGP fringes across the graphene edge in samples with spacer thickness t = 18 nm (blue) and 8 nm (black; fitted EF = −0.49 eV). Inset: s(x,y) over the sample with t = 8 nm. All data is at ω = 1150 cm–1.
