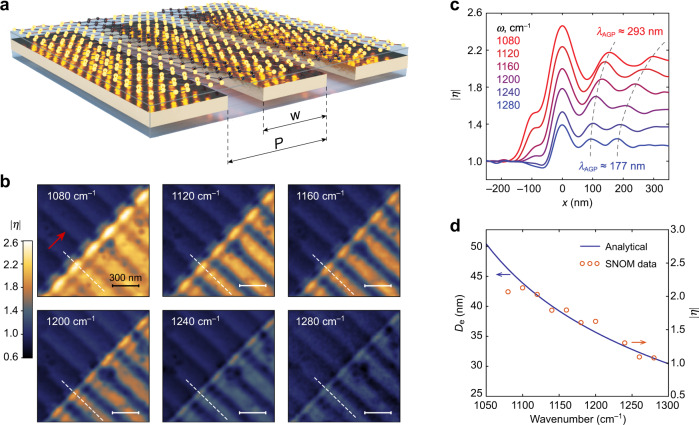
Fig. 4. Near-field imaging of AGP over the periodic array of gold nanoribbons embedded in alumina.
a Schematics of the structure with gold nanoribbons of width w arranged in an array with period P. b Near-field contrast obtained at different frequencies over the same sample area; P = 270 nm, w = 240 nm, and t = 18 nm. Red arrow indicates the tip illumination direction. c Profile of across the graphene edge along the dashed lines in (b) showing smaller AGP wavelength and at higher excitation frequencies, indicating the stronger AGP confinement. d Spectral dependency of maximal above graphene measured far from the edge (circles) and calculated De (solid) for the sample shown in (b).

