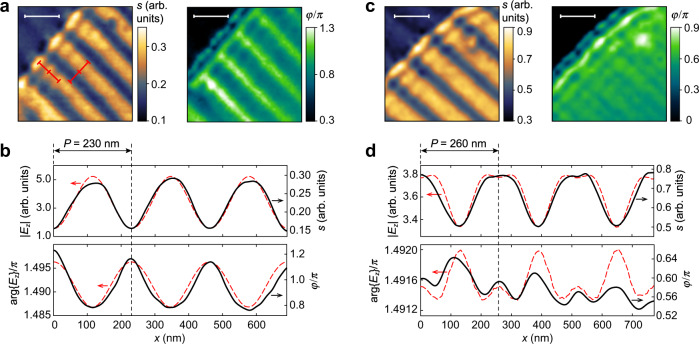
Fig. 5. Near-field profile of AGP across the gold nanoribbons.
a Near-field signal amplitude s(x,y) and phase φ(x,y) at the sample with P = 230 nm (t = 18 nm, EF = –0.62 eV, λAGP ≈ 228 nm) at ω = 1200 cm–1 when the AGP momentum kAGP is similar to the array momentum 2π/P (indicated by the identical red scale bars of 230 nm). b Profiles of s(x,y) (top panel) and φ(x,y) (bottom panel) shown in (a), measured across the nanoribbons (black solid), and the numerically obtained (red dashed) by the full-wave FEM simulations |Ez | (top panel) and arg{Ez} (bottom panel). c Same as in (a), measured at the sample with P = 260 nm (t = 18 nm, EF = –0.52 eV, λAGP ≈ 225 nm) at ω = 1150 cm–1 when kAGP > 2π/P. d Same as in (b), showing the irregular near-field profile attributed to the mixed signal form the several array modes. White scale bars are 300 nm.

