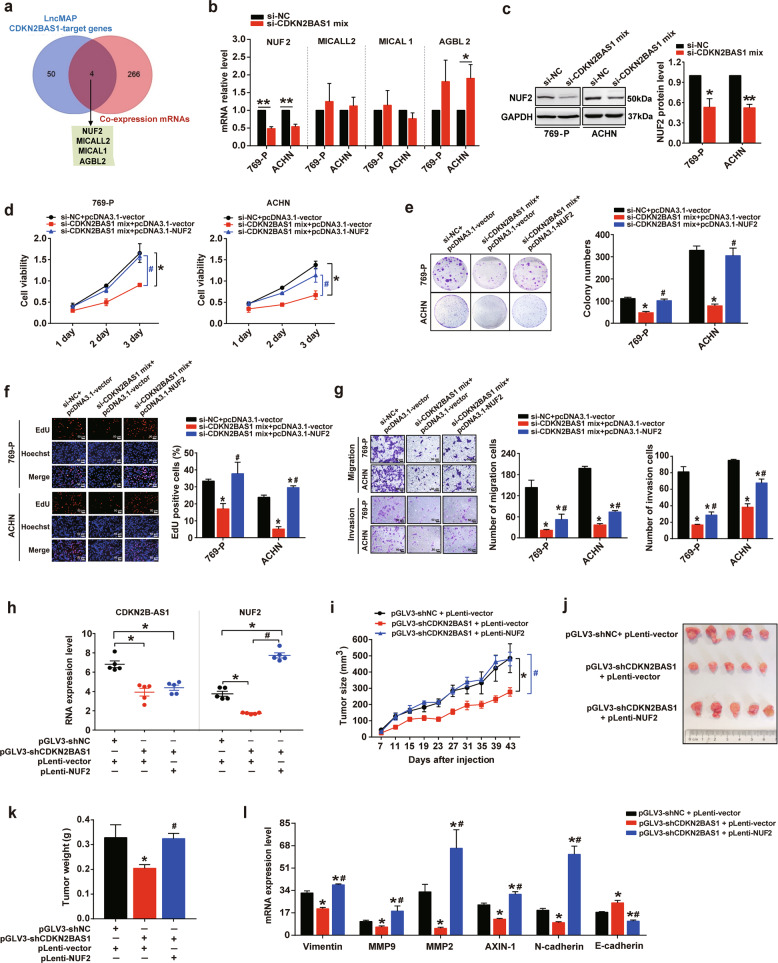
Fig. 3. CDKN2B-AS1 contributes to KIRC progression via NUF2 in vitro and in vivo.
a Venn diagram showing the genes that may be regulated by CDKN2B-AS1 (54 genes), co-expressed with CDKN2B-AS1 (270 genes), or both (4 genes). b, c qRT-PCR analysis of NUF2, MICALL2, MICAL1, and AGBL2 expression in 769-P and ACHN cells transfected with the si-CDKN2B-AS1 mix for 48 h, β-actin was used as the internal control (b); western blot analysis of NUF2 protein expression with GAPDH as the internal control and quantitation of protein levels performed using densitometry (c). d–g 769-P and ACHN cells were transfected with si-CDKN2B-AS1 mix plus pcDNA3.1-NUF2 plasmid for 48 h; CCK-8 (d), colony formation (e), and EdU (f) assays were performed to assess cell viability and proliferation; transwell assays (g) were used to evaluate cell migration and invasion; ImageJ software was used for cell counting. Scale bar: 50 μm. h–l qRT-PCR analysis of CDKN2B-AS1, NUF2, vimentin, MMP9, MMP2, AXIN-1, N-cadherin, and E-cadherin expression in tumor tissues of BALB/c nude mice subcutaneously injected in the flank with ACHN cells pre-infected with the lentiviral vector (n = 5 per group); β-actin was used as the internal control (h, l); growth curves of tumors in the nude mice (i); representative images (j), and weight of the xenografts derived from the nude mice (k). Error bars represent the SEM, **p < 0.01 vs. si-NC; *p < 0.05 vs. si-NC or si-NC + pcDNA3.1-vector or pGLV3-shNC + pLenti-vector; #p < 0.05 vs. si-CDKN2B-AS1 mix + pcDNA3.1-vector or pGLV3-shCDKN2BAS1 + pLenti-vector. Data are representative from at least three independent experiments, p value calculated by independent sample t test (b, c), one-way ANOVA and Student–Newman–Keuls test (d–i, k, l).

