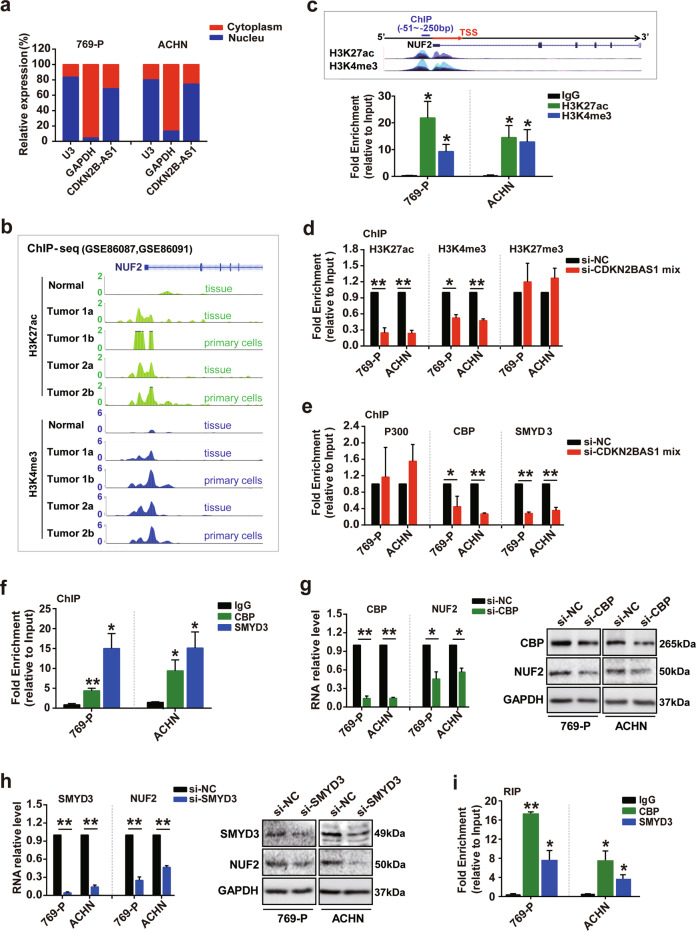
Fig. 4. CDKN2B-AS1 regulates NUF2 transcription by acting as a modular scaffold of CBP and SMYD3 complex to affect H3K27ac and H3K4me3 modification.
a qRT-PCR subcellular analysis of CDKN2B-AS1 in 769-P and ACHN cells, U3 and GAPDH acted as nucleus and cytoplasm markers, respectively. b ChIP-seq analysis of H3K27ac and H3K4me3 enrichment at the NUF2 promoter region in normal renal tissues, KIRC tissues, and tumor tissue-derived primary cells. c, f ChIP analysis of H3K27ac and H3K4me3 (c), and the chromatin-modifying enzymes CBP and SMYD3 (f) enrichment in the NUF2 gene promoter; ChIP enrichment was measured using real-time PCR, normalized by the input DNA. d, e 769-P and ACHN cells were transfected with the si-CDKN2B-AS1 mix for 48 h; ChIP analysis of H3K27ac, H3K4me3, and H3K27me3 (d), and the chromatin-modifying enzymes P300, CBP, and SMYD3 (e) enrichment in the NUF2 gene promoter; ChIP enrichment was measured using real-time PCR, normalized by the input DNA. g, h qRT-PCR and western blot analysis of CBP, SMYD3, and NUF2 mRNA and protein expression in 769-P and ACHN cells transfected with si-CBP (g) and si-SMYD3 (h) for 48 h, respectively; β-actin or GAPDH was used as the internal control, respectively. i RIP assay analysis of CBP and SMYD3 enrichment in CDKN2B-AS1 in 769-P and ACHN cells; RIP enrichment was measured using qRT-PCR normalized by the input RNA. Error bars represent the SEM from three independent experiments, **p < 0.01 vs. IgG or si-NC, *p < 0.05 vs. IgG or si-NC. P value calculated by independent sample t test (d, e, g, h), one-way ANOVA, and Dunnett multiple comparison test (c, f, i). TSS transcription start site.

