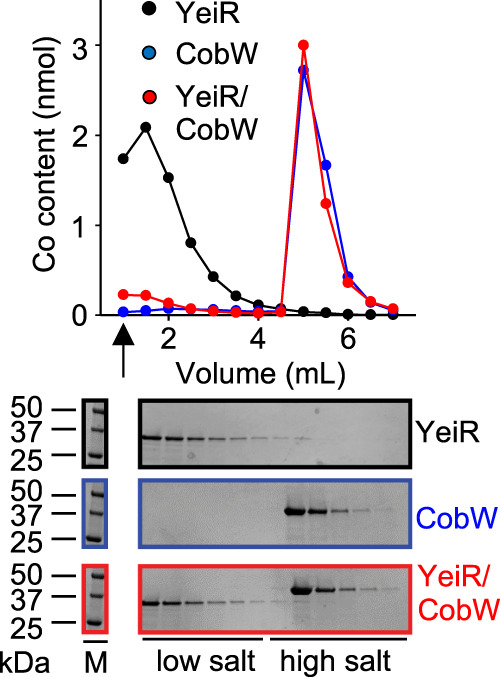
Fig. 7. MgIIGTP-CobW outcompetes MgIIGTP-YeiR for CoII.

Elution profile of YeiR (10 μM), CobW (10 μM) or both proteins following incubation with GTP (100 μM), MgII (2.7 mM) and CoII (8 μM) resolved by differential elution from an anion exchange column. Fractions were analysed for CoII by ICP-MS and protein by SDS-PAGE (YeiR alone black, CobW alone blue, both proteins red; n = 1). Arrow denotes flow through fractions. Full gel images and SDS-PAGE analysis of flow through fractions shown in Supplementary Fig. 26.
