
Figure 10.
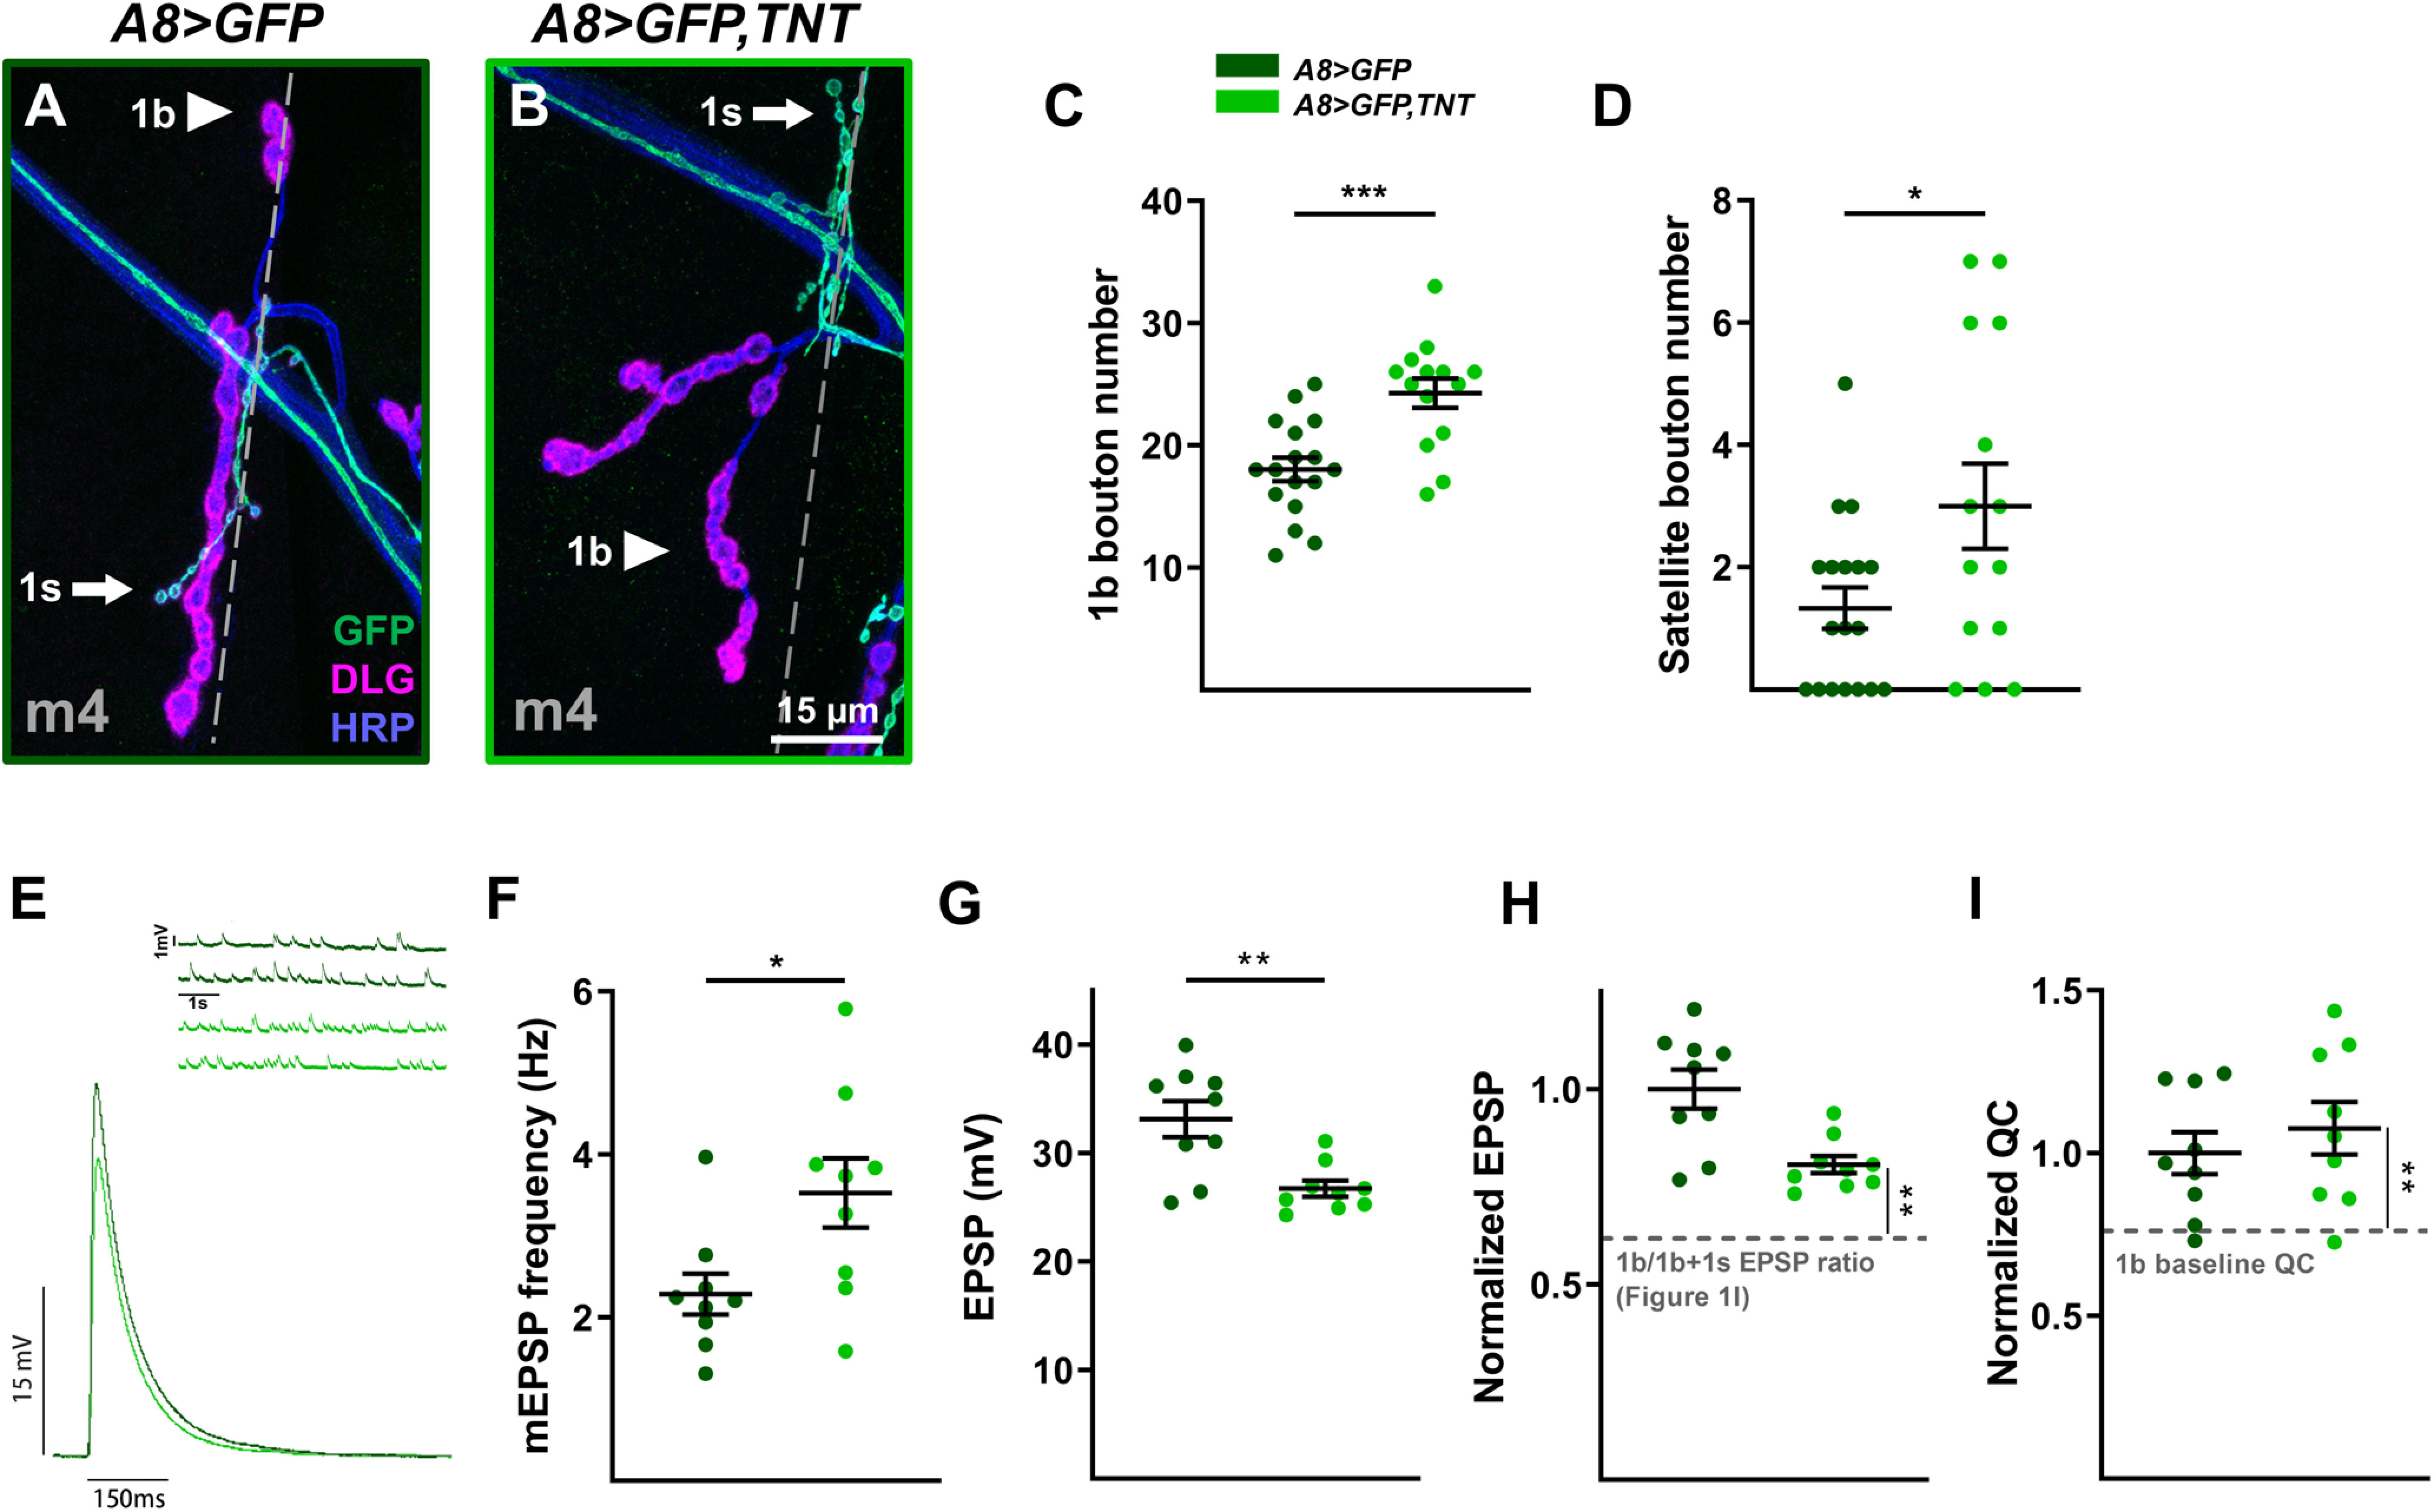
Loss of 1s evoked neurotransmission contributes to 1b synaptic plasticity. A, B, Representative m4 NMJs labeled with GFP (green), DLG (magenta), and HRP (blue) in control (A; A8>GFP: dark green) and 1s-silenced (B; A8>GFP,TNT: light green) animals. C, Quantification of 1b boutons on m4 in control and 1s-silenced animals (t(29) = 4.099, p = 0.0003, unpaired t test). Images, representative traces, and graphs are color coded as indicated in the color key. D, Quantification of satellite boutons from m4 in control and 1s-silenced animals (t(18.90) = 2.161, p = 0.0437, unpaired t test with Welch's correction). E, Representative mEPSP and EPSP recordings in control and 1s-silenced animals. F, Quantification of mEPSP frequencies from m4 in control and 1s-silenced animals (t(16) = 2.515, p = 0.0230, unpaired t test). G, Quantification of EPSP amplitudes in control and 1s-silenced animals (t(11.01) = 3.529, p = 0.0047, unpaired t test with Welch's correction). H, Normalized EPSP from m4 in control and 1s-silenced animals (t(20.75) = 3.736, p = 0.0012, unpaired t test with Welch's correction). Normalized EPSP of 1s-silenced animals is compared with the EPSP ratio of 1b/1b + 1s calculated from m4 in Figure 1I, indicated by gray dashed line. I, Normalized QC from m4 in control and 1s-silenced animals (t(23) = 3.159, p = 0.0044, unpaired t test). QC from 1s-silenced m4 was estimated using corrected EPSP and estimated 1b-derived mEPSP amplitude. Normalized QC was compared with 1b baseline QC (see Materials and Methods). Error bars indicate ±SEM. *p < 0.05, **p < 0.01, ***p < 0.001. n values (NMJs/larva) are 14/10, 17/9 for C and D, and 9/7, 9/6 for E–I.