
Figure 8.
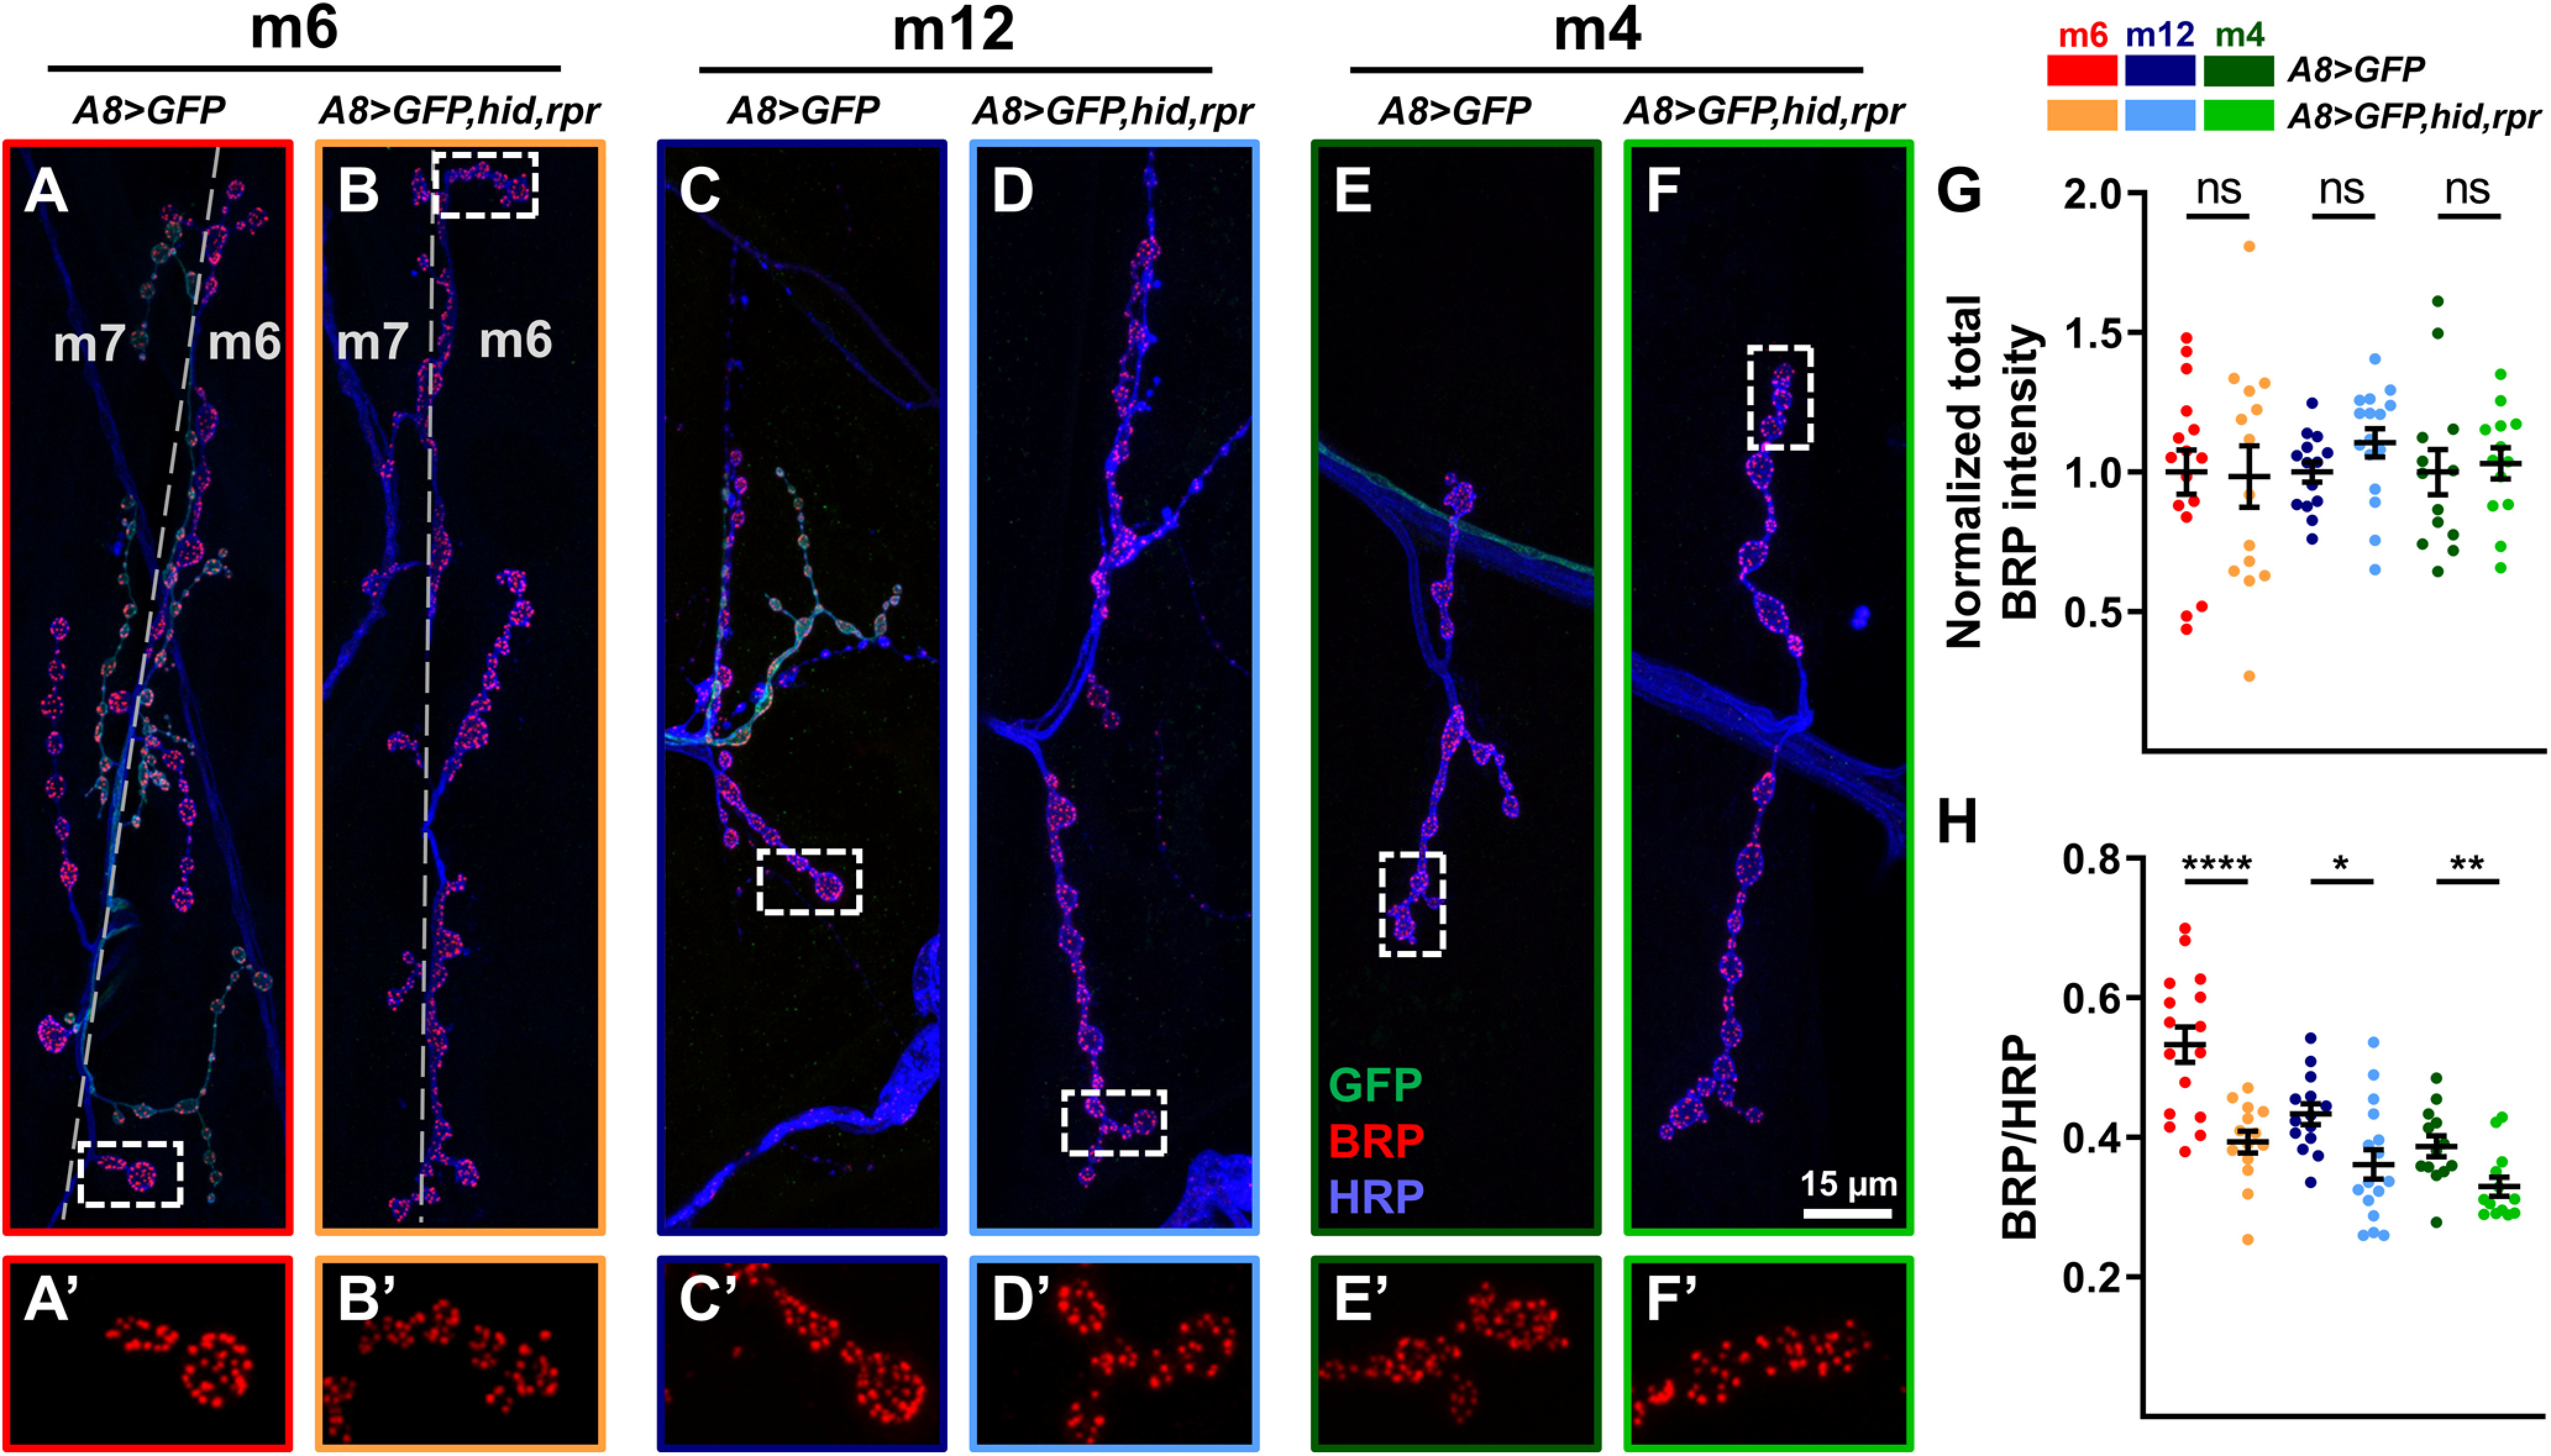
Quantification of BRP levels at 1b NMJs. A–F, Representative BRP immunostaining from m6 (A, B), m12 (C, D), and m4 (E, F) in control (A8>GFP) and 1s-ablated (A8>GFP,hid,rpr) animals labeled with GFP (green), BRP (red), and HRP (blue). A′–F′, 2.5× zoomed 1b boutons corresponding to dashed regions in A–F showing BRP staining. G, Quantification of normalized total BRP intensity of 1b NMJs on m6 (t(28) = 0.1199, p = 0.9054, unpaired t test), m12 (t(28) = 1.627, p = 0.1148, unpaired t test), and m4 (t(24) = 0.3189, p = 0.7525, unpaired t test). Images and graphs are color coded as indicated in the color key. H, Quantification of BRP/HRP sum intensity ratio (density) from m6 (t(24.31) = 4.705, p < 0.0001, unpaired t test with Welch's correction), m12 (t(28) = 2.736, p = 0.0107, unpaired t test), and m4 (t(24) = 2.847, p = 0.0089, unpaired t test). Error bars indicate ±SEM. *p < 0.05, **p < 0.01, ****p < 0.0001, ns - not significant. n values (NMJs/larva) are 16/8, 14/8, 14/8, 16/8, 13/7, and 13/7, respectively.