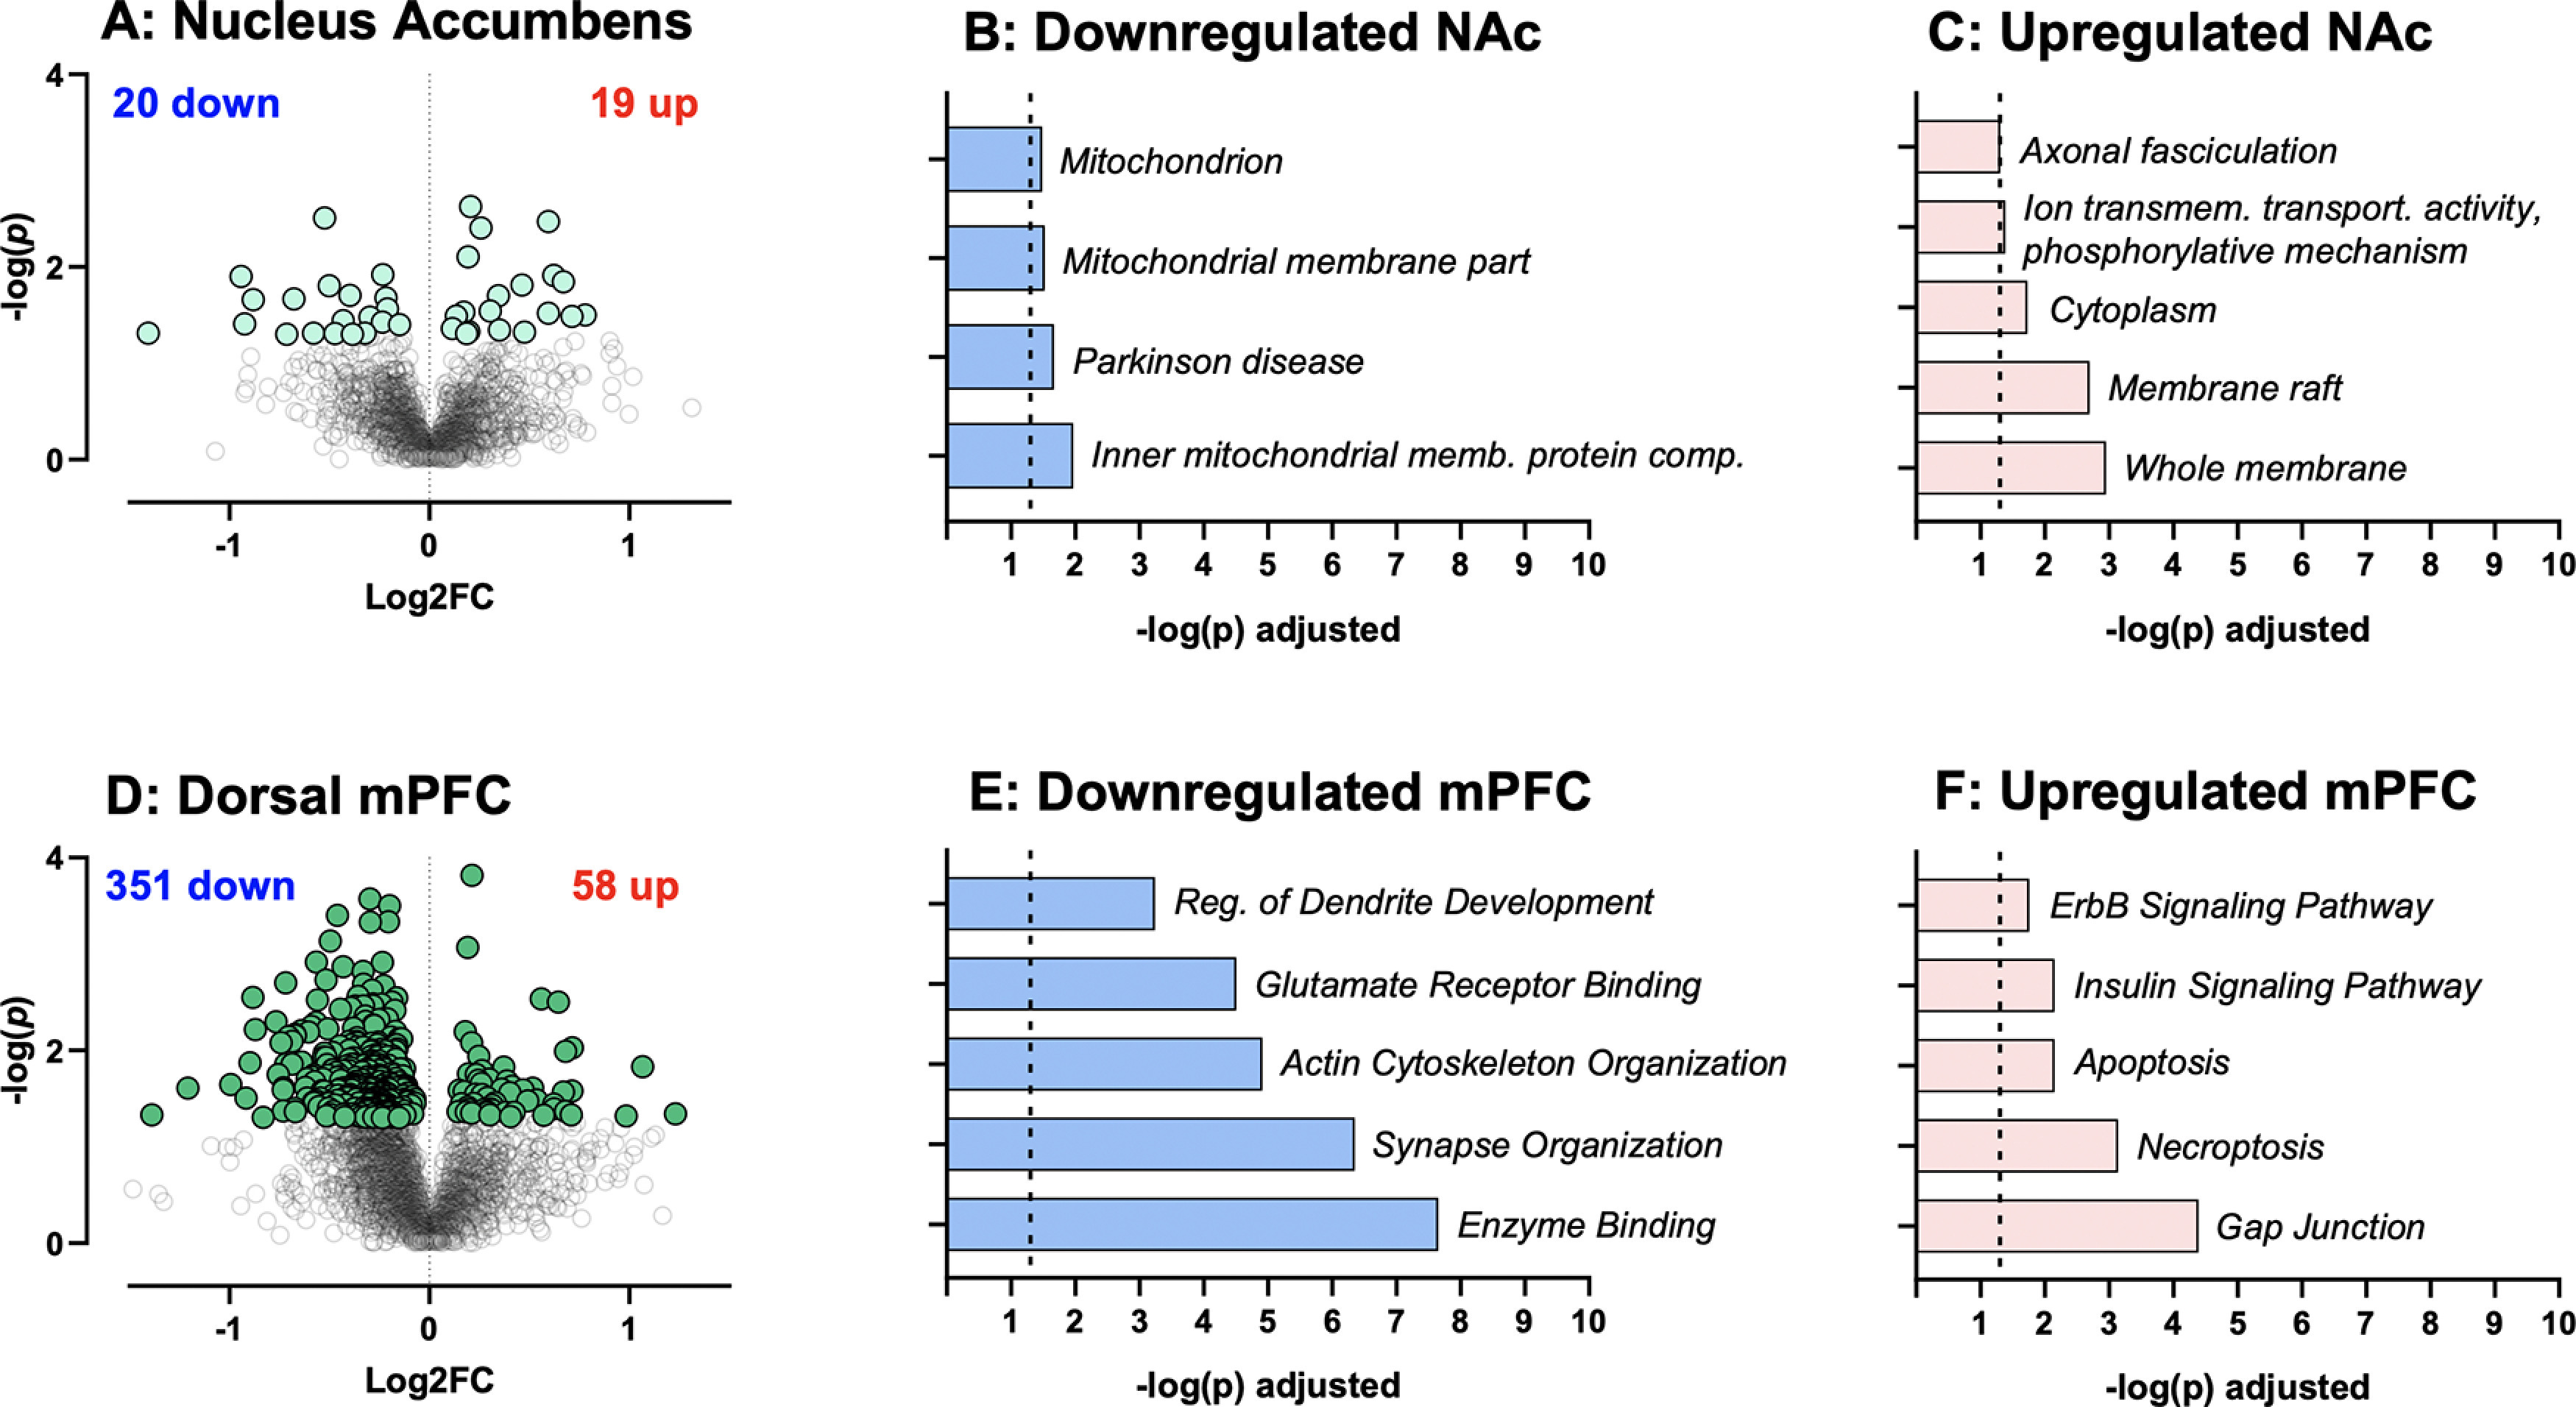
Figure 4.

Proteomic effects of G-CSF on NAc and dorsal mPFC. A, Volcano plot depicting differential protein expression in the NAc between rats treated with G-CSF compared with PBS controls. Extended Data Figure 4-1 lists all regulated proteins in the NAc with statistics. B, C, Significantly altered pathways in NAc identified from G:Profiler using significantly downregulated and upregulated inputs. Extended Data Figure 4-2 has details of significant ontologies. D, Volcano plot depicting differential protein expression between rats treated with G-CSF compared with PBS in mPFC. Extended Data Figure 4-3 lists all regulated proteins in the mPFC with statistics. E, F, Significantly altered pathways in mPFC identified from G:Profiler using significantly downregulated and upregulated inputs. Extended Data Figure 4-4 lists details of significant ontologies.
