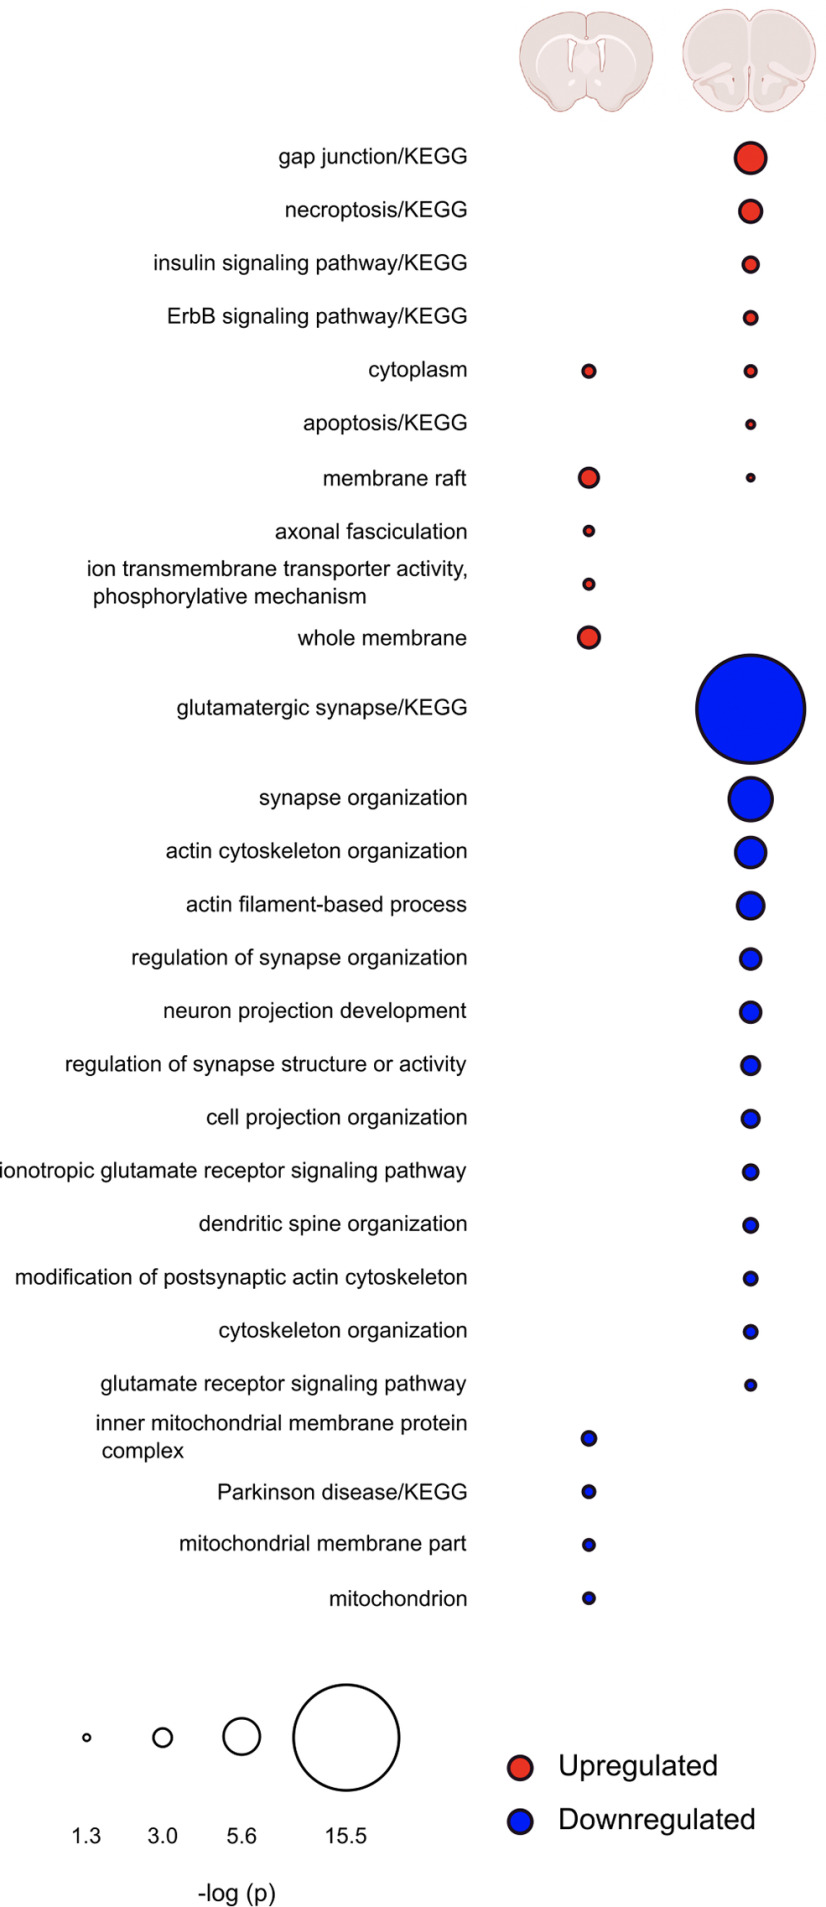
Figure 5.
Comparison of regulated pathways in mPFC and NAc after G-CSF treatment. Overlap of pathways found to be significantly enriched by G-CSF treatment in NAc (left) or mPFC (right). Upregulated pathways are indicated in red, downregulated in blue. Radius of circles is the FDR-corrected -log p value of that pathway. Blank spaces for either brain region indicate no proteins from that pathway were significantly regulated by G-CSF in that region.

