Figure 6.
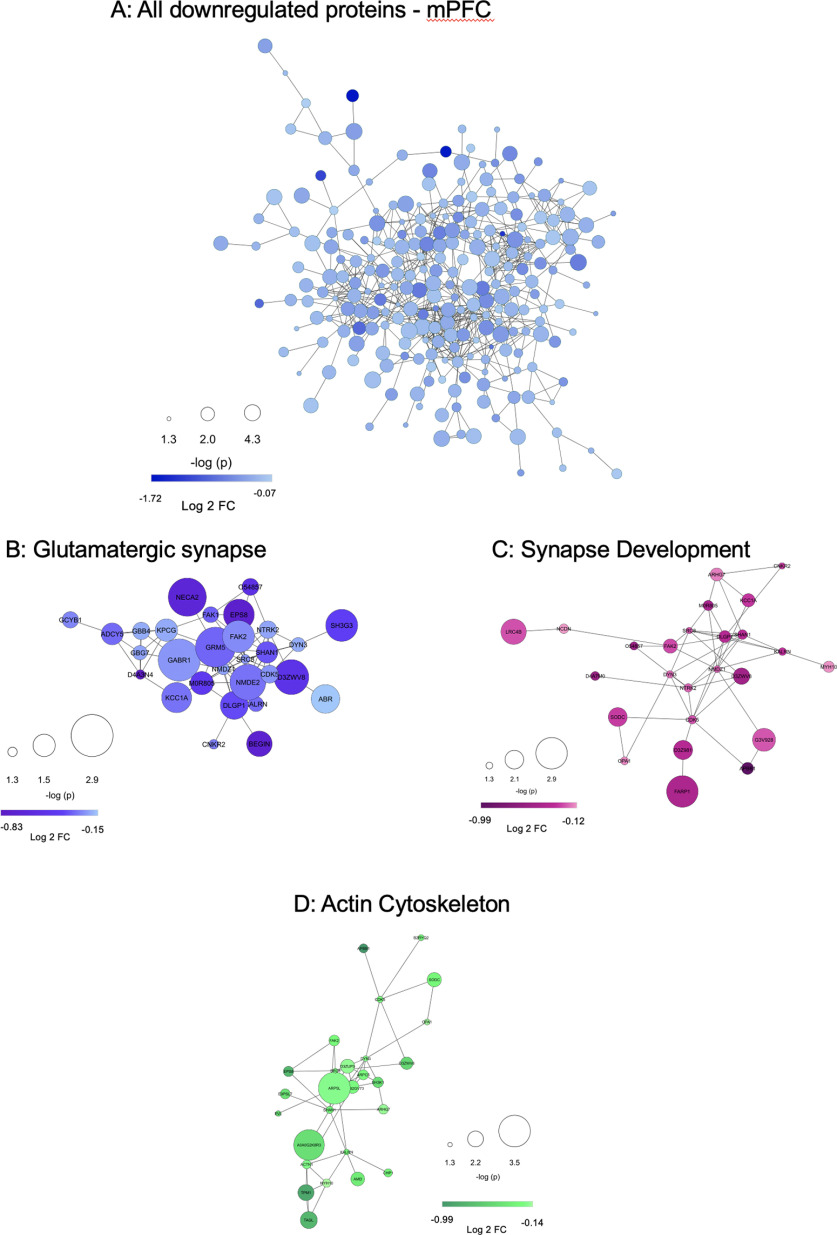
Downregulated proteins in the mPFC are from densely interactive networks with enrichment for synapses. A, STRING protein interaction diagram of all proteins significantly downregulated by G-CSF in mPFC. Enrichment of interacting proteins is strongly statistically significant (p < 1.0 × 10⁻¹⁶) with an average number of 5.44 interactions per protein. Selected pathways were isolated from G:Profiler analyses to highlight interactions among downregulated proteins related to glutamatergic pathways (B), regulation of synapse development (C), and actin cytoskeleton-related pathways (D), all of which have significantly more PPIs than would be predicted by chance (p < 1.0 × 10⁻¹⁶ for all). Protein nodes differ by size (-log p value, larger node = smaller p value) and color (darker color = greater fold change from PBS). Extended Data Figure 6-1 details STRING connectivity analysis for each network. Extended Data Figure 6-2B–D has detailed analysis of proteins identified.

