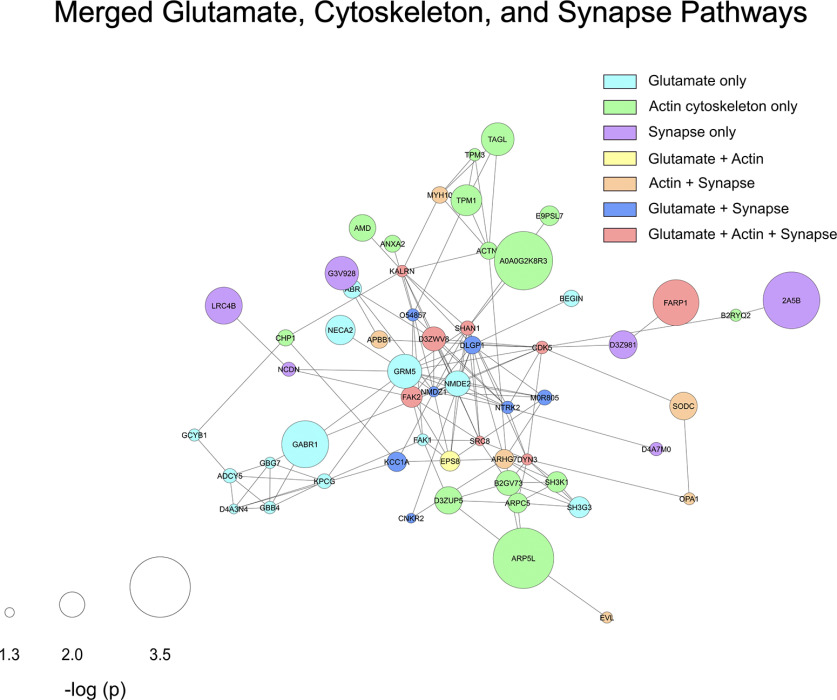
Figure 7.
Overlap of synaptic and cytoskeletal protein interactions in the mPFC. Using the regulated proteins from glutamate, synaptic, and cytoskeletal pathways, a STRING diagram was created showing the effect of G-CSF treatment on these critical regulators of synaptic plasticity and function. This network has 138 predicted PPIs compared with the 29 that would be predicted by chance (PPI p value < 1.0 × 10⁻¹⁶; average node degree 3.83). Node color indicates pathway membership as shown in legend. Node size correlates with -log p value compared with PBS control.

