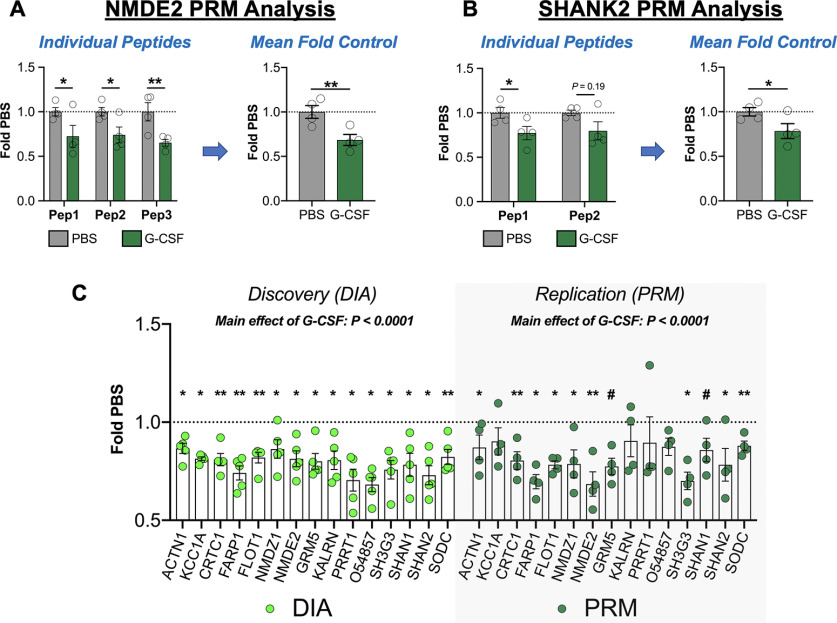
Figure 8.
Replication of discovery proteomics analysis with PRM analysis. To ensure the validity of our initial DIA discovery proteomics analysis, a subset of key proteins was validated using targeted proteomics. A, As an example of a targeted protein with three analyzed peptides, data for NMDE2 are presented. On the left, the individual data for each peptide are shown, and then these values were averaged to quantify total protein change. B, SHANK2 is shown as an example in which two peptides were merged from a protein. C, Data from the discovery DIA analysis (left) are shown in comparison to replication (right), and levels of each protein are changed in the same direction with both methodologies, and there is a robust main effect of G-CSF with both methods. All data presented as means ± SEM, *p < 0.05, **p < 0.01, # p < 0.1 (replication only). Peptides analyzed from each protein are available in Extended Data Figure 8-1, and detailed statistics from both methods are presented in Extended Data Figure 8-2.

