
Figure 10.
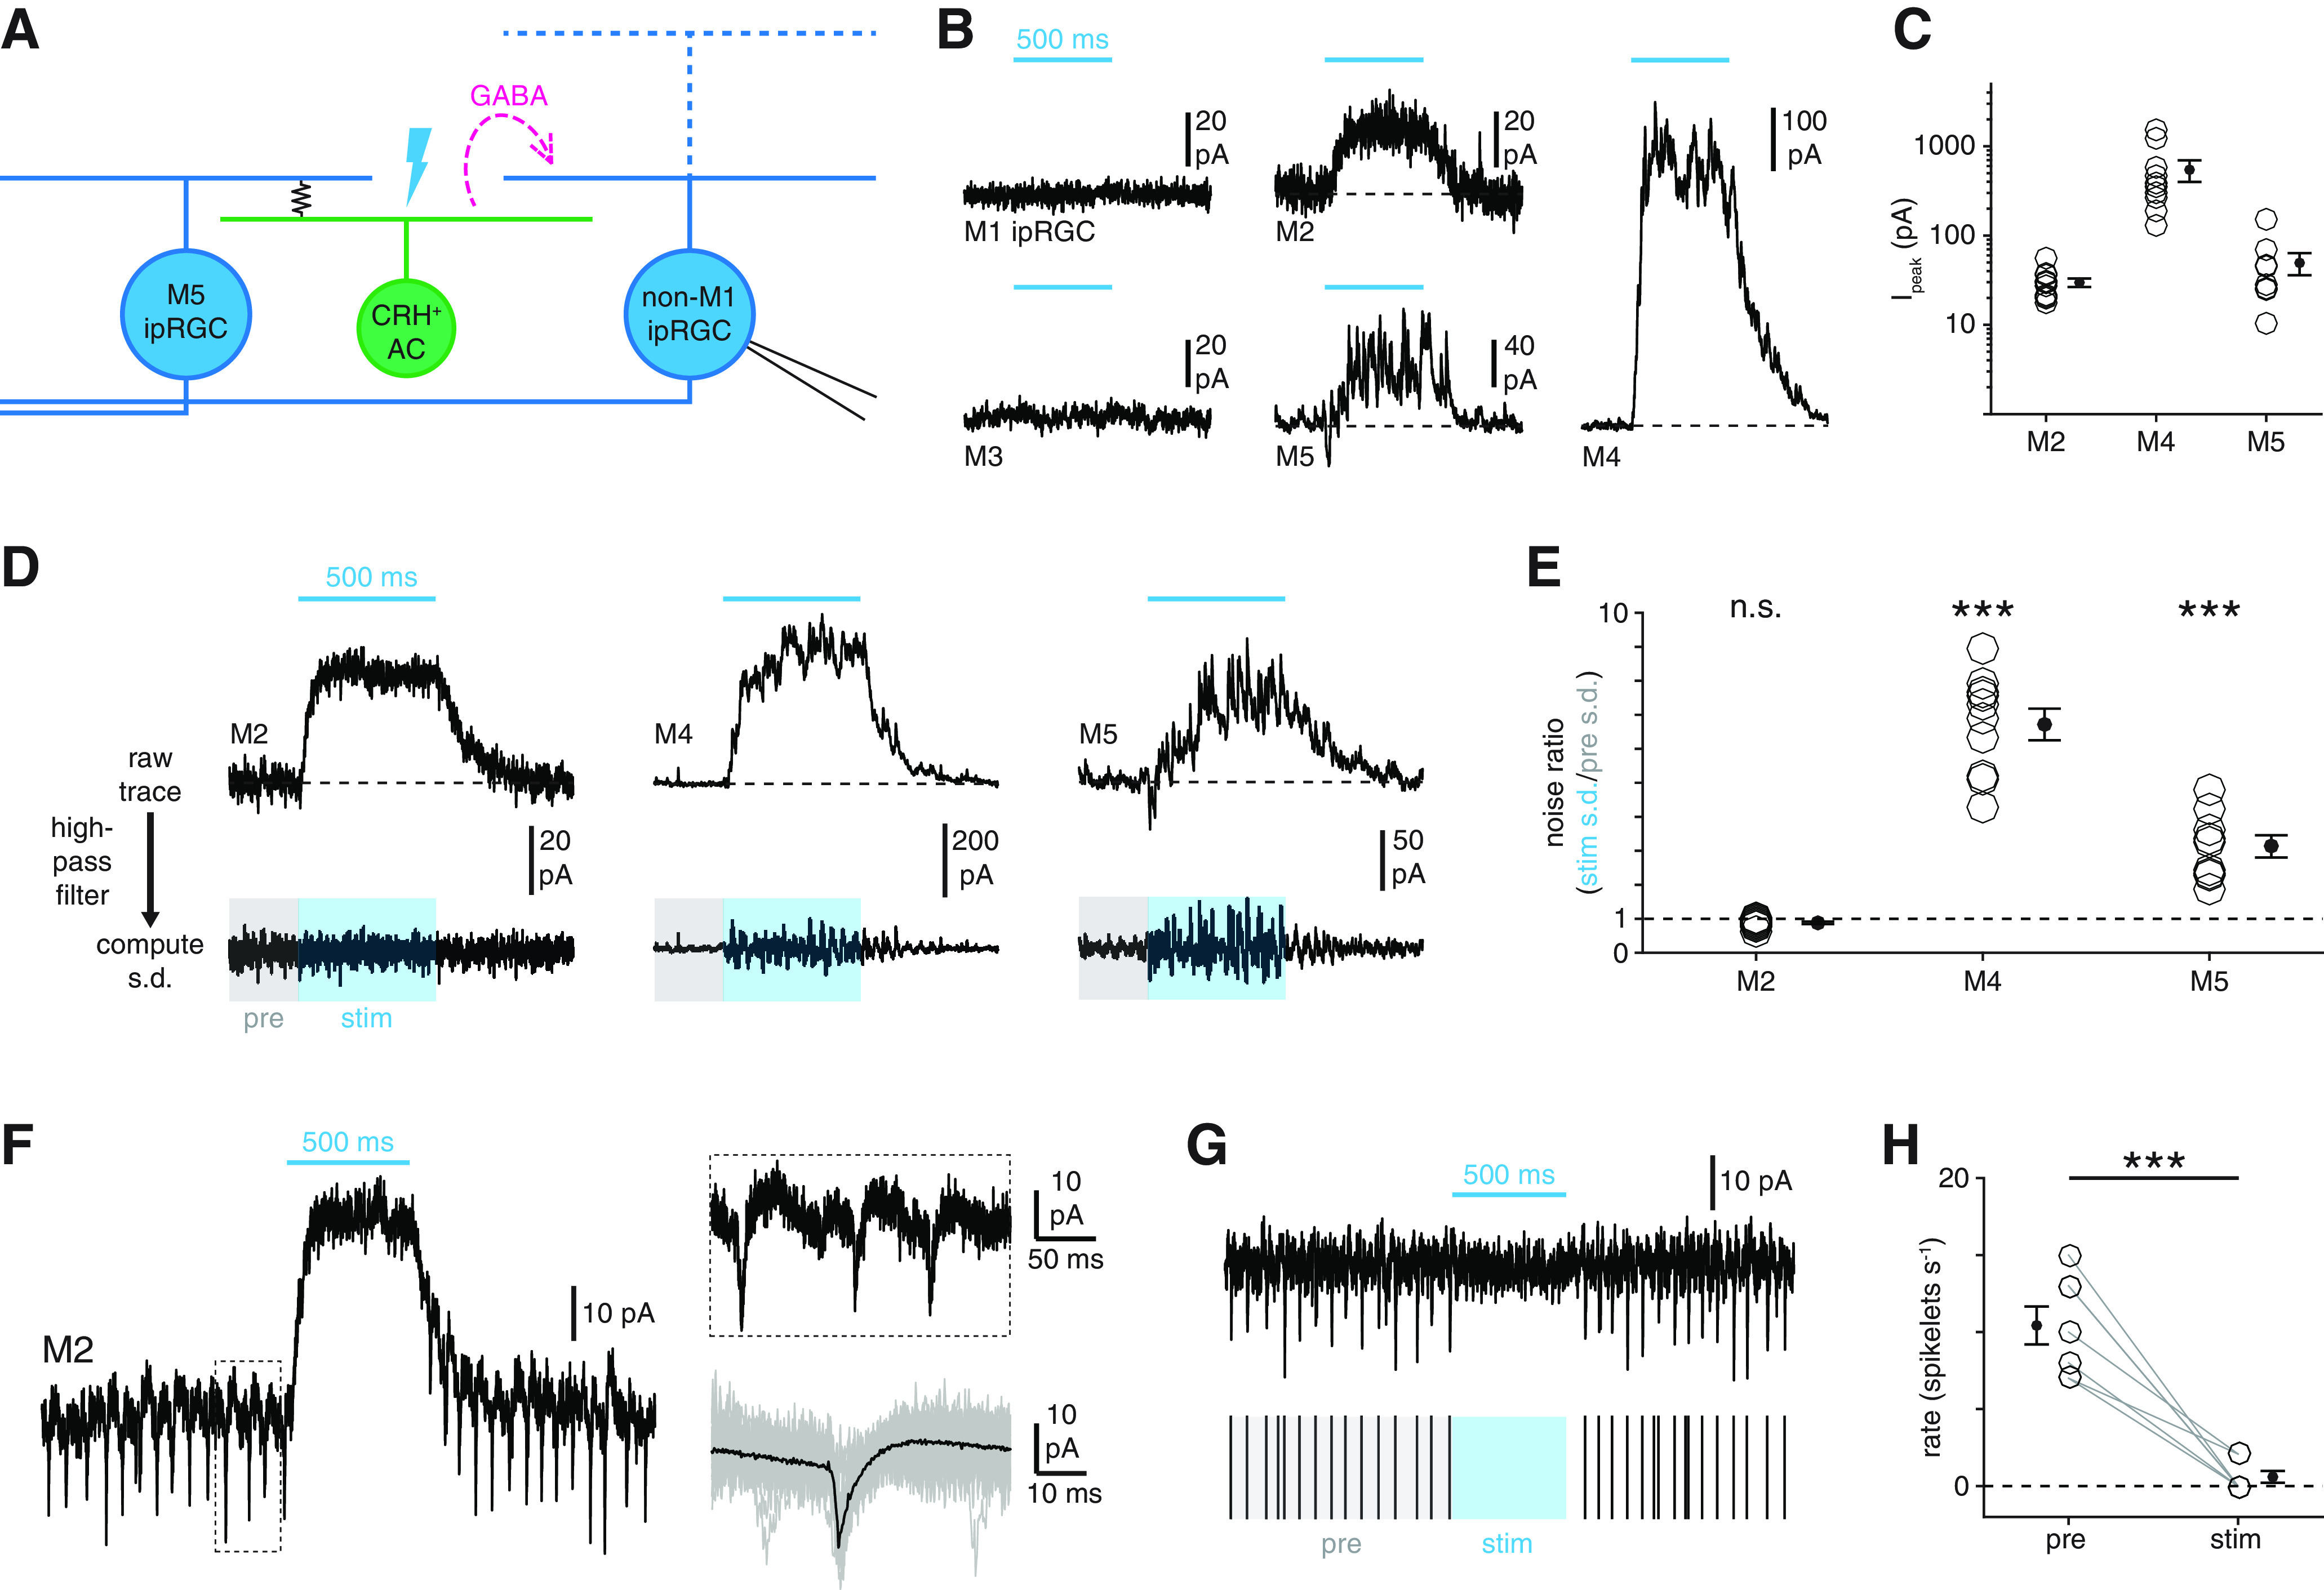
Cell type specificity of synaptic inhibition by CRH+ ACs. A, Circuit diagram represents GABAergic inhibition (dashed magenta arrow) of an ipRGC (right, blue) evoked by optogenetic stimulation of an M5 ipRGC-coupled CRH+ AC (green, middle). B, Membrane currents of M1-M5 ipRGCs during optogenetic stimulation of CRH+ ACs (Vhold = Ecation = 0 mV). Cyan bars represent stimulus period (Φstim = 4.8 × 10¹⁷ Q cm−2 s−1). C, Amplitudes of inhibitory currents evoked in M2 (n = 11), M4 (n = 10), and M5 (n = 9) ipRGCs during optogenetic stimulation of CRH+ ACs. D, Noise analysis of inhibitory currents evoked by CRH+ AC stimulation. Top row, Currents recorded in an M2, an M4, and an M5 ipRGC during optogenetic stimulation of CRH+ ACs. Bottom row, Currents shown at top after high-pass filtering (20 Hz cutoff). Noise ratio is the SD of the current during the stimulus period (stim, blue-shaded window) divided by the SD during a prestimulus period (pre, gray-shaded window). E, Noise ratios in M2, M4, and M5 ipRGCs evoked by CRH+ AC stimulation. F, Physiological evidence for electrical coupling between M2 ipRGCs and spiking neurons. Left, Membrane current of an M2 ipRGC (Vhold = 0 mV) during optogenetic stimulation of CRH+ ACs. Top right, Expanded view of the boxed period at left. Bottom right, Mean (black) of 135 individual spikelets (gray, 50 shown) measured in the same cell. G, CRH+ AC stimulation suppresses spikelet rate in M2 ipRGCs. Top, Black trace represents high-pass filtered membrane current of M2 ipRGC shown in F during CRH+ AC stimulation. Bottom, Spikelet times extracted from top trace with prestimulus (pre, gray) and stimulus (stim, blue) periods indicated. H, CRH+ AC stimulation-evoked changes in spikelet rates in M2 ipRGCs (n = 7). ***p < 0.001.