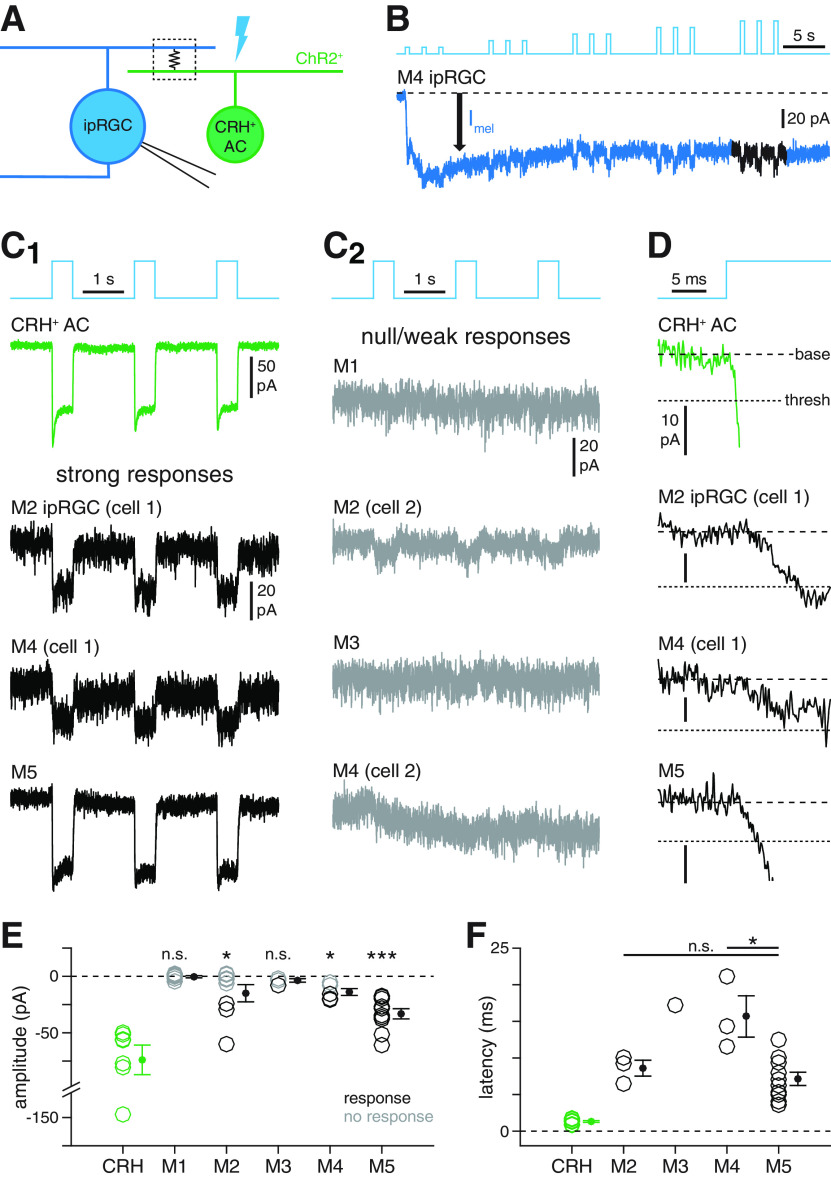
Figure 6.
Selectivity of electrical coupling between ipRGC types and CRH+ ACs. A, Circuit diagram illustrating electrophysiological assay for ipRGC-CRH+ AC coupling. Optogenetic stimulation of a CRH+ AC (green, right) expressing ChR2 generates a photocurrent that propagates to a recorded ipRGC (blue, left) via a gap junction-mediated electrical synapse (boxed resistor symbol). B, Experimental isolation of ChR2-dependent coupling currents from melanopsin-dependent photocurrents in ipRGCs. Blue trace represents current (Vhold = −70 mV) recorded from an M4 ipRGC during repeated photostimulation of ChR2+ CRH+ ACs (Φmax = 4.8 × 10¹⁷ Q cm−2 s−1). Initially, a melanopsin-mediated inward current (Imel, black arrow) dominates the measured response. During later stimuli, fast inward currents are evident. Black represents the analyzed period of the response. C, Patterns of coupling currents measured in M1-M5 ipRGC types during optogenetic stimulation of CRH+ ACs. C1, Green trace represents light-evoked ChR2 currents recorded in a CRH+ AC. Black traces represent examples of fast inward currents recorded in M2, M4, and M5 ipRGCs during optogenetic stimulation of CRH+ ACs. C2, Gray traces represent examples of weak or null responses in M1-M4 ipRGCs during optogenetic stimulation of CRH+ ACs. D, Latencies of coupling currents in ipRGCs. Traces represent the response near stimulus onset for the cells shown in C1. Coarse dashed lines indicate prestimulus baseline current. Fine dashed lines indicate response threshold. E, ChR2 photocurrent amplitude in CRH+ ACs (n = 7 cells) and coupling current amplitude in M1-M5 ipRGCs (n = 7, n = 8, n = 4, n = 5, and n = 10 cells, respectively). F, Coupling current latency for all cells in E exhibiting suprathreshold responses (CRH: n = 7; M2: n = 3; M3: n = 1; M4: n = 3; M5: n = 10). *p < 0.05. ***p < 0.001.

