Figure 7.

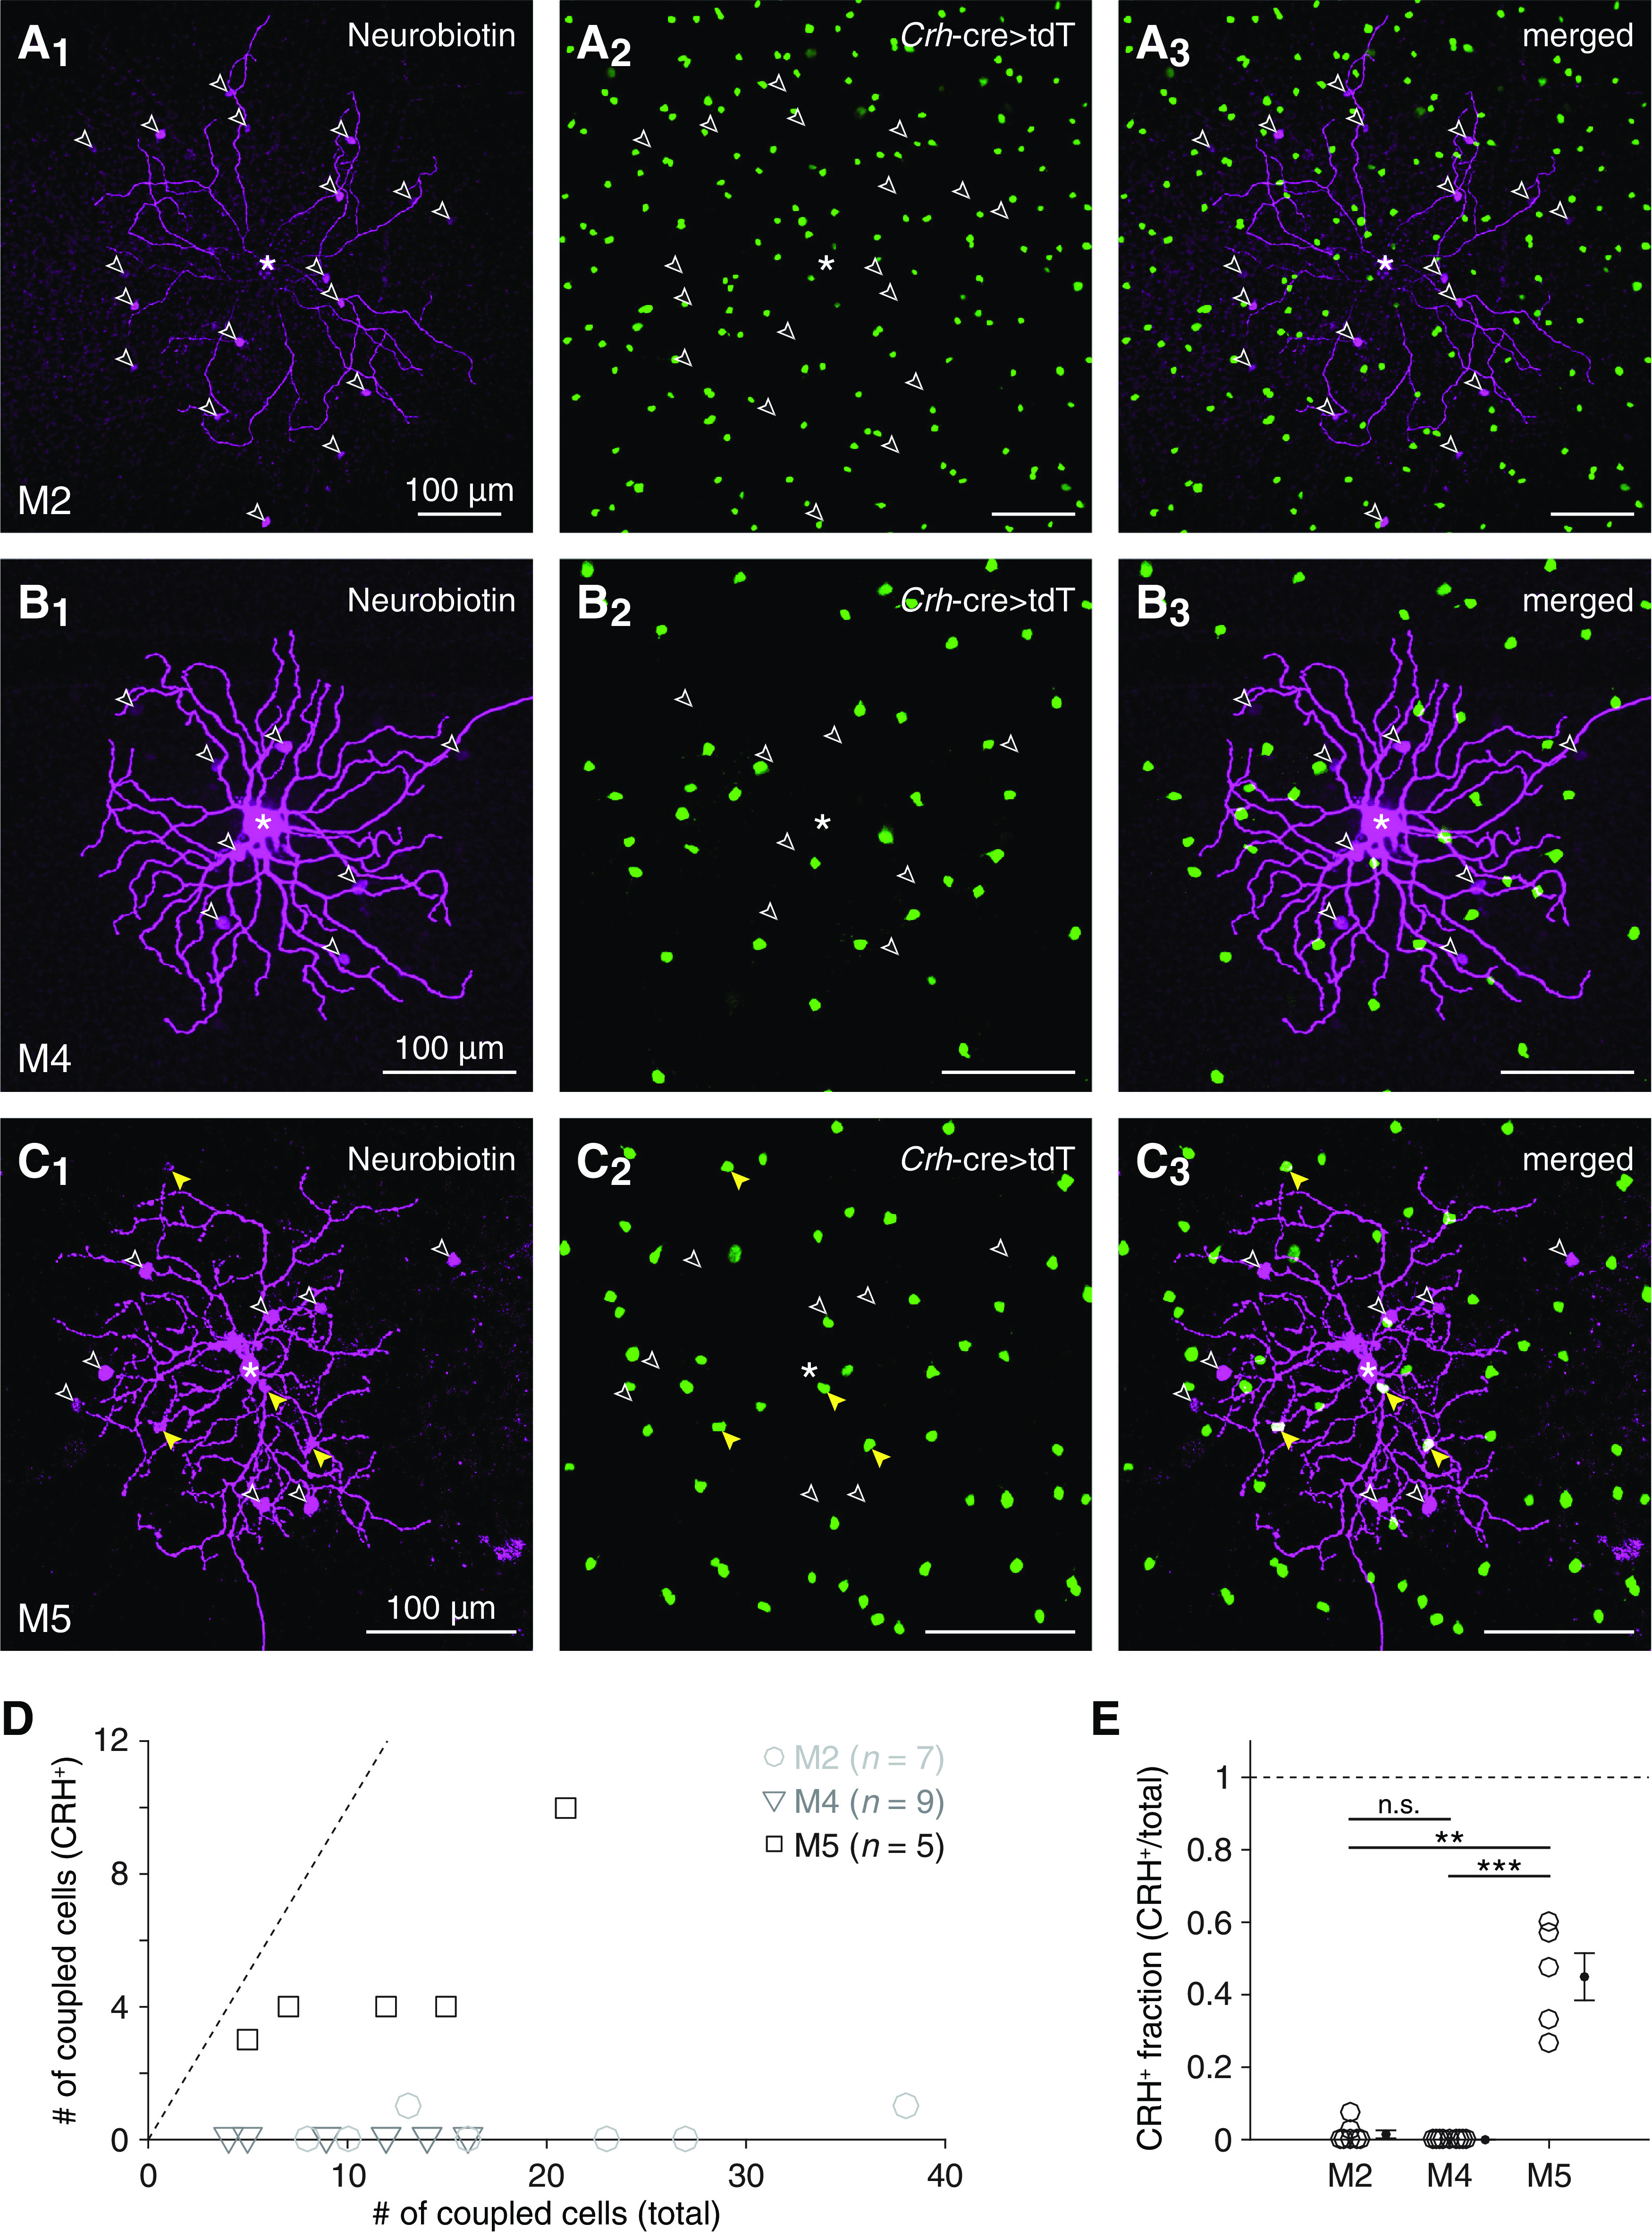
Selectivity of tracer coupling between ipRGC types and CRH+ ACs. A, Visualizing overlap between cells exhibiting Crh-ires-cre-dependent fluorescence and cells tracer-coupled to an M2 ipRGC. Confocal micrographs of Neurobiotin labeling (magenta) in an injected M2 ipRGC and tracer-coupled somas (A1); tdT expression (green) in putative CRH+ ACs, driven by a Crh-ires-cre allele (Crh-cre>tdT) (A2); and their overlap (A3). *Soma of the Neurobiotin-injected M2 ipRGC. Empty arrowheads indicate Neurobiotin-filled somas that lack tdT expression. B, Same format as in A for an M4 ipRGC. C, Same format as in A and B for an M5 ipRGC. Yellow arrowheads indicate Neurobiotin-filled somas of tdT+ cells. D, Total number of tracer-coupled cells plotted against number of tracer-coupled CRH+ ACs for all Neurobiotin-injected M2 (n = 7), M4 (n = 9), and M5 (n = 5) ipRGCs. Dashed line indicates unity (i.e., cases where all tracer-coupled cells are CRH+ ACs). E, Fraction of tracer-coupled cells that were putative CRH+ ACs, for each M2, M4, and M5 ipRGC shown in D. **p < 0.01. ***p < 0.001.
