
Figure 3.
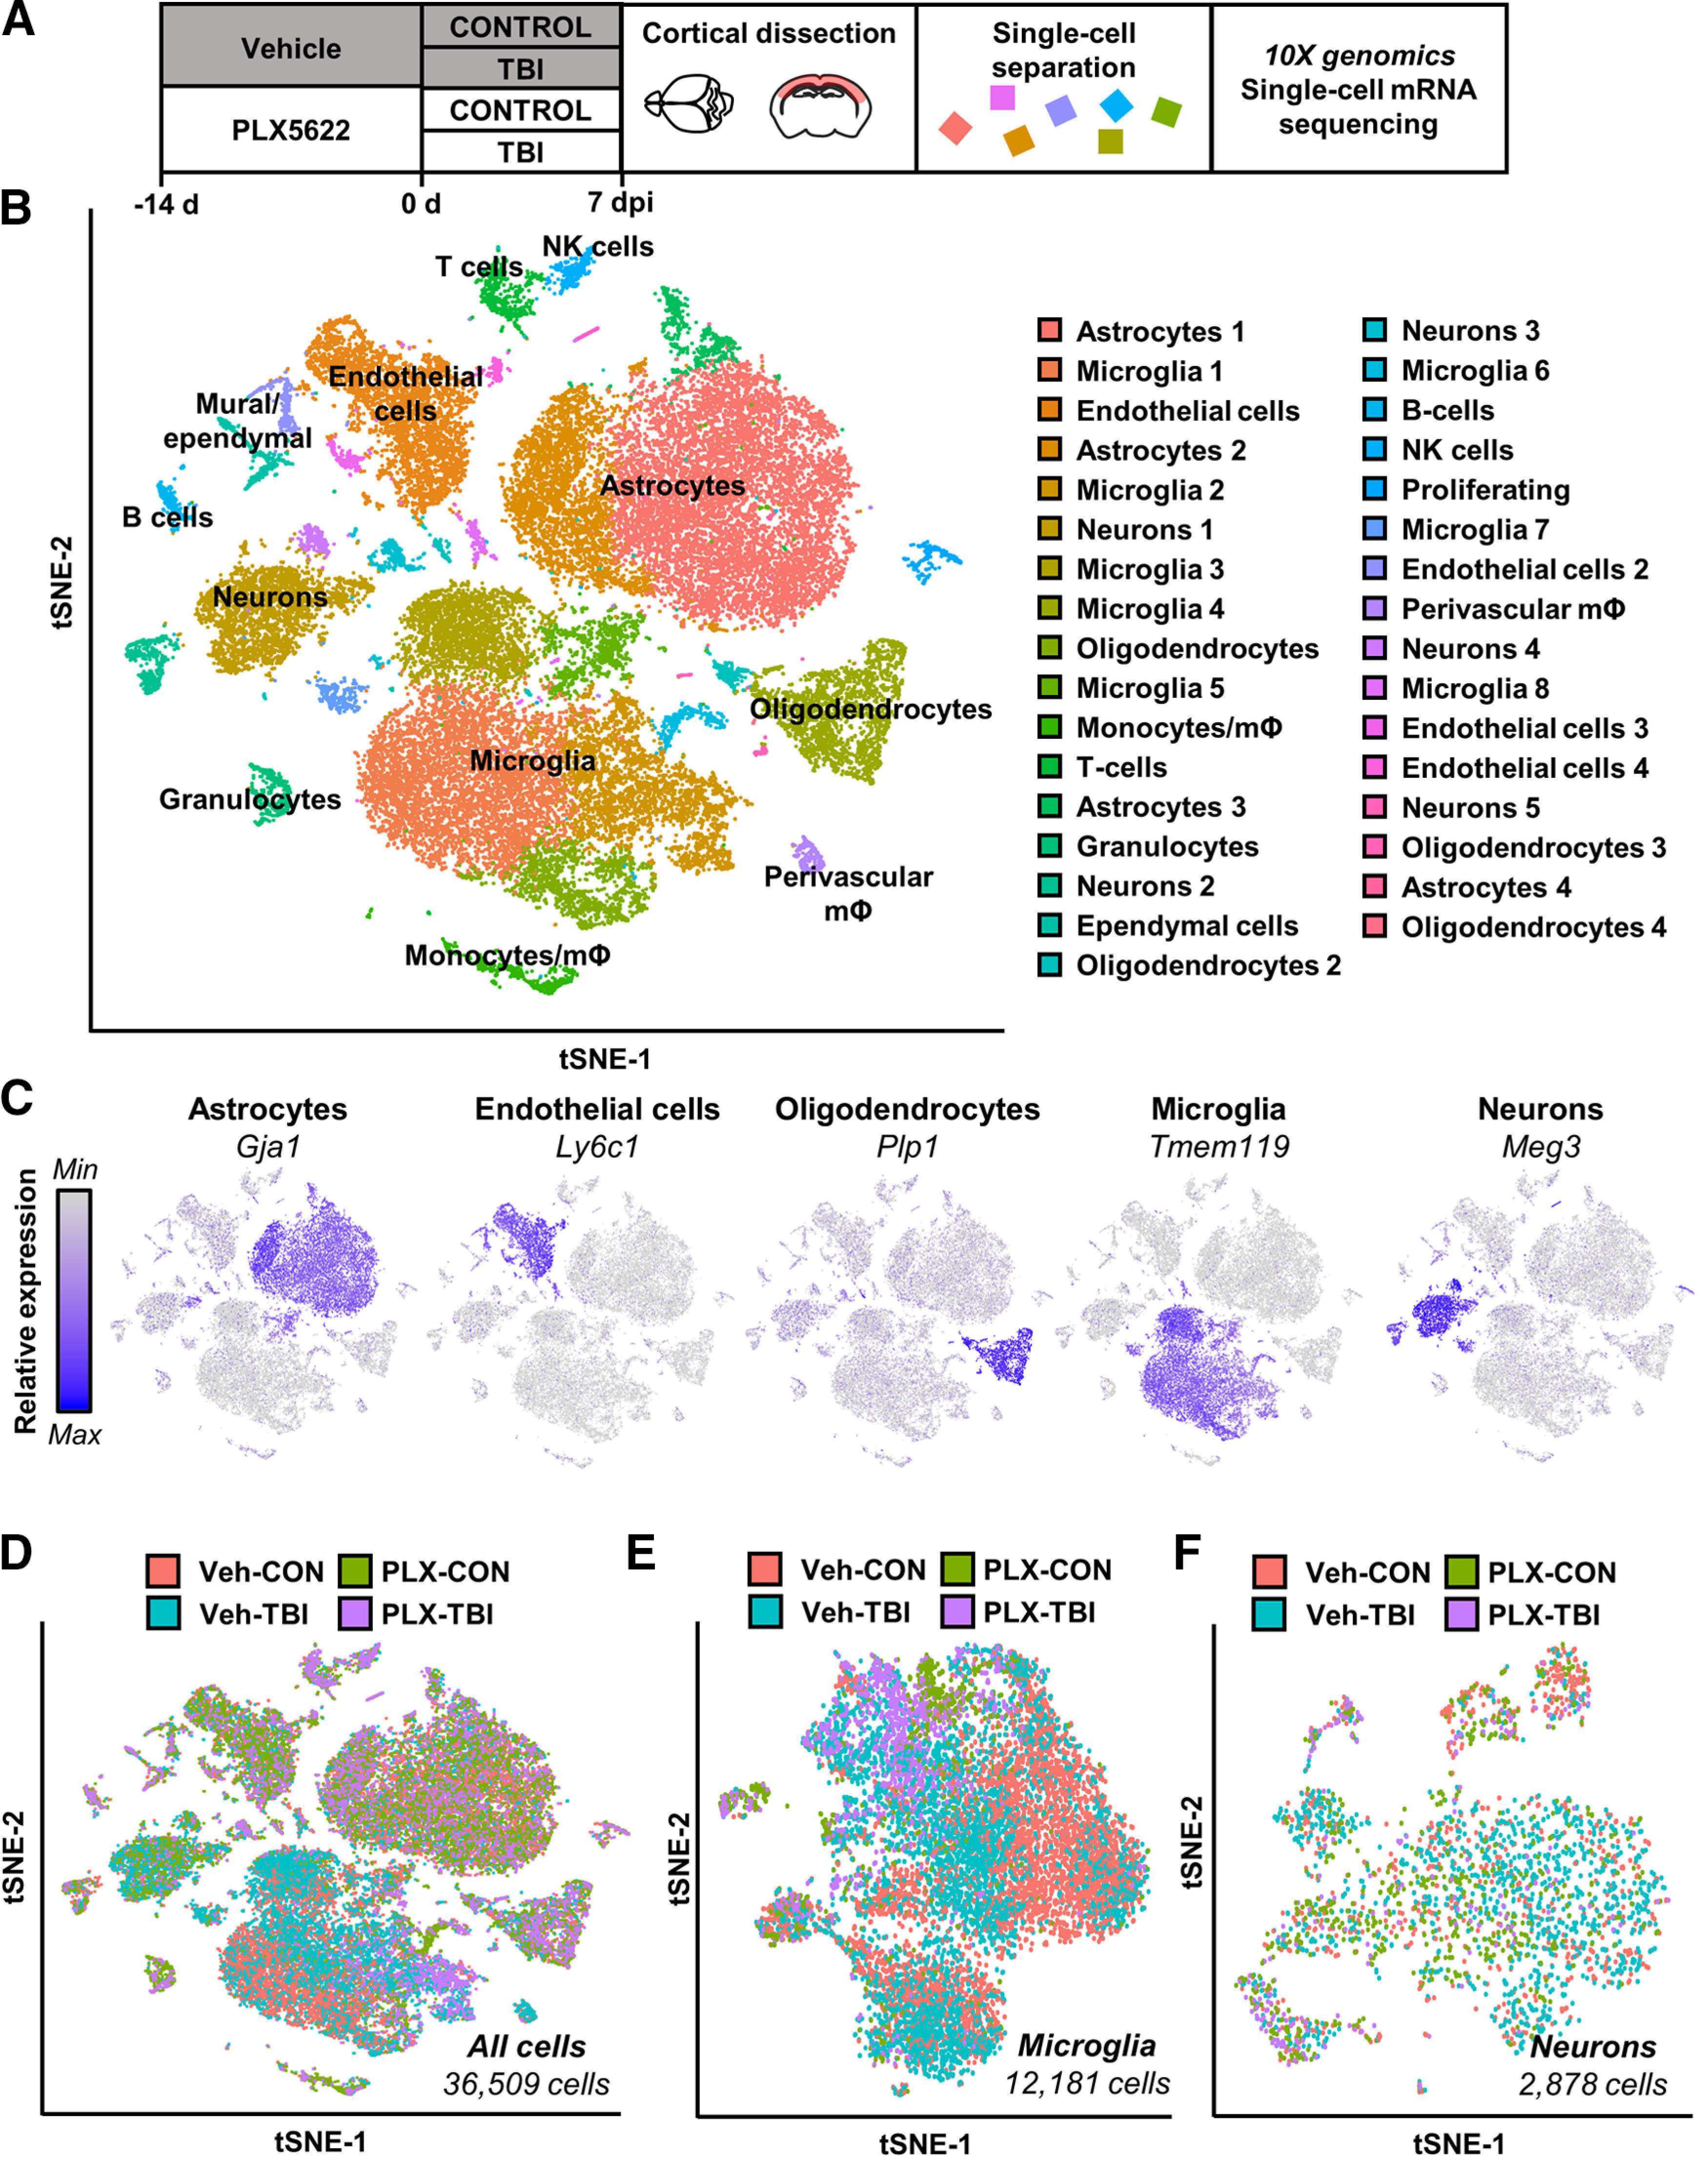
Single-cell RNA sequencing of cortex 7 dpi. A, Adult C57BL/6 mice were provided diets formulated with either vehicle (Veh) or PLX5622 (PLX) for 14 d. Next, mice were uninjured (Con) or were subjected to mFPI (TB1). Mice were maintained on vehicle or PLX diet for the duration of the experiment. Mice were killed 7 dpi, and the cortex was microdissected and enzymatically digested into a single-cell suspension. Cortices from three mice were pooled from each group; data reflect two replicate experiments (n = 6 mice per group). Single cells were run on a 10× genomics chromium controller, mRNA from individual cells was barcoded, and cDNA libraries were generated and sequenced. Sequencing results were aligned to the mouse mm10 genome and doublets and low-quality cells were removed. Clustering and differential expression was generated using Seurat in R. B, tSNE clusters show individual cell types identified based on marker gene expression. C, tSNE plots highlight primary CNS cell types by marker gene expression: astrocytes (Gja1), endothelial cells (Ly6c1), oligodendrocytes (Plp1), microglia (Tmem119), and neurons (Meg3). D, tSNE highlights distribution of all cells across experimental groups. Subclusters of microglia (E) and neurons (F) were selected based on expression of Tmem119 and Meg3, respectively. tSNE plots highlight distribution of experimental groups within subclusters. tSNE plots in Extended Data Figure 3-1 represent distribution of cells across the four experimental groups: (1) Veh-CON, (2) PLX-CON, (3) Veh-TB1, and (4) PLX-TB1. Results from cluster expression analysis and differential expression for cell type subsets is available in Extended Data Figure 3-2.