
Figure 4.
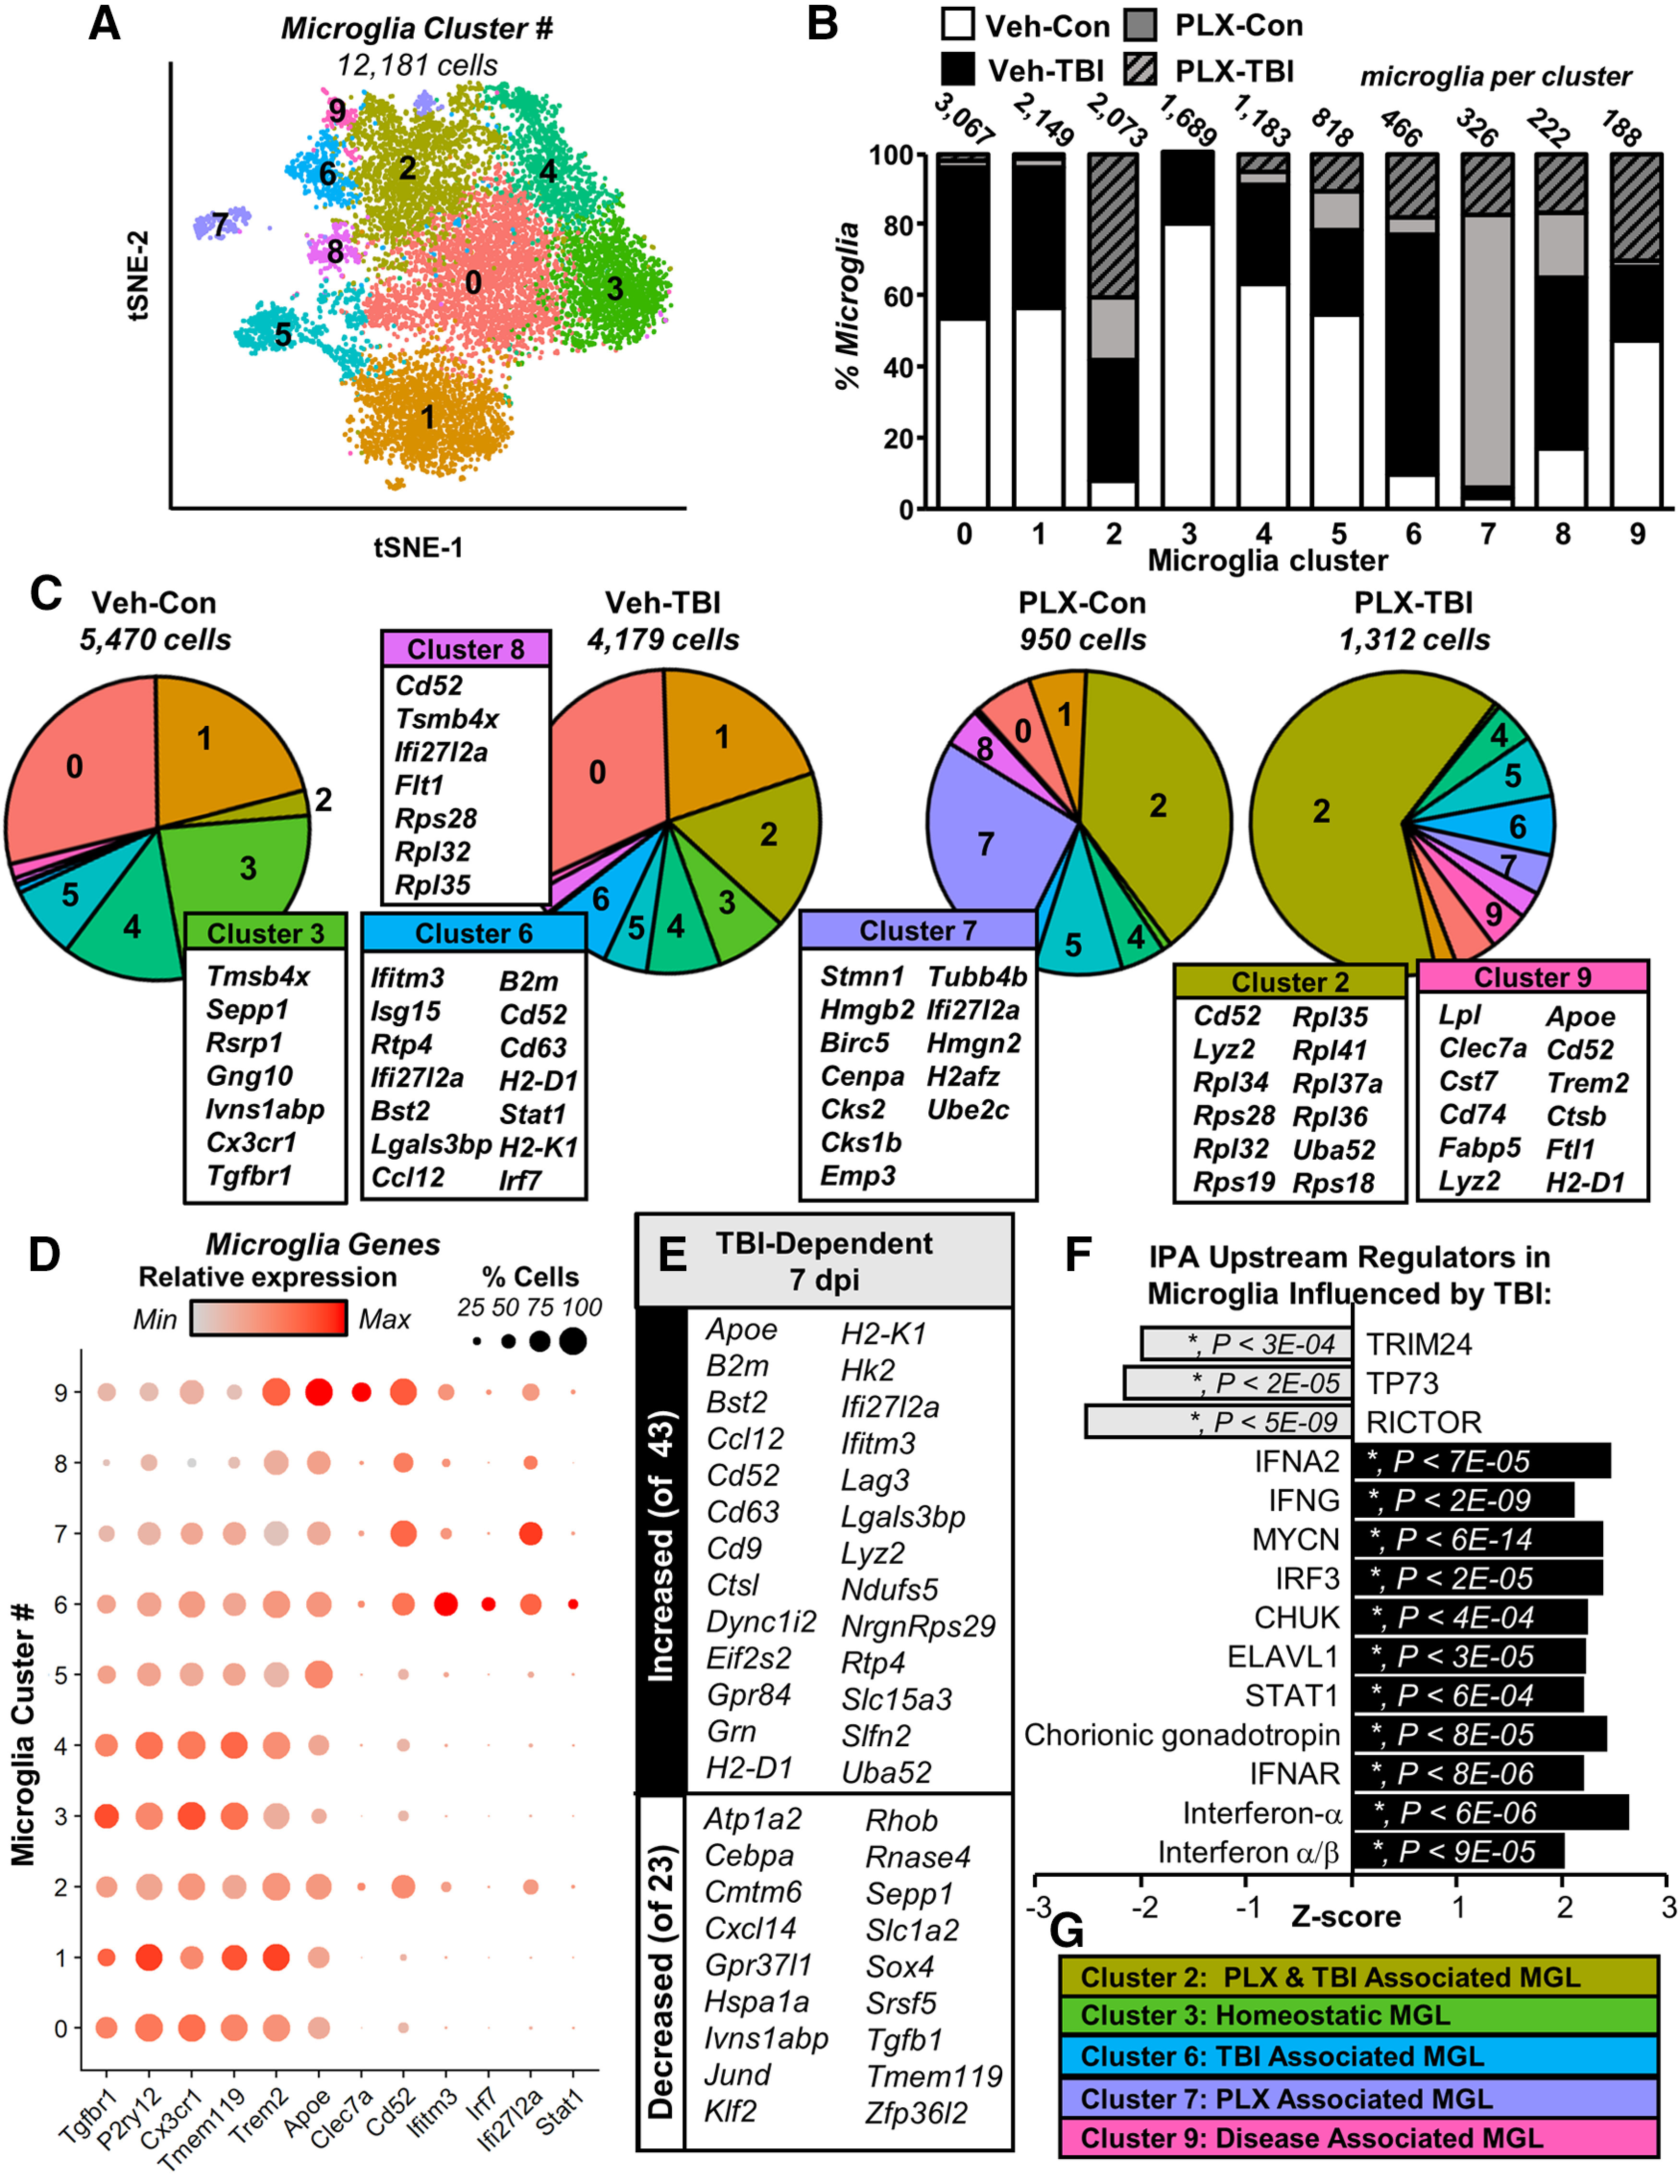
Trauma-associated mRNA signatures and increased type-1 interferon signaling evident in cortical microglia after TB1. Adult C57BL/6 mice were provided diets formulated with either vehicle (Veh) or PLX5622 (PLX) for 14 d. Next, mice were uninjured (control) or were subjected to mFPI (TB1). Mice were maintained on vehicle or PLX diet for the duration of the experiment. Mice were killed 7 dpi, and single cells were isolated and sequenced as described in Figure 3. A, tSNE reflects subclustering of Tmem119+ microglia (12,181 cells) from all samples. B, Distribution of microglia from each experimental condition across the 10 microglial clusters. C, Pie-graphs reflect proportion of each experimental condition in each microglial cluster. Top genes expressed significantly more in a given cluster than in all other microglia are shown. D, Dot plot shows relative and proportional expression of microglial signature (Tgfbr1, P2ry12, Cx3cr1, Tmem119), neurodegenerative-associated (Trem2, Apoe, Clec7a, Cd52), and interferon-related genes (Ifitm3, Irf7, Ifi27l2a, Stat1). E, Subset of genes increased (top) and decreased (bottom) in Veh-TB1 compared with Veh-Con (p-adj < 0.05). F, IPA (upstream regulators) of significantly differentially expressed genes between Con-Veh and TB1-Veh (p-adj < 0.05). G, Clusters enriched in specific experimental groups. Heatmap in Extended Data Figure 4-1 reflects top genes expressed by each Tmem119+ microglia cluster.