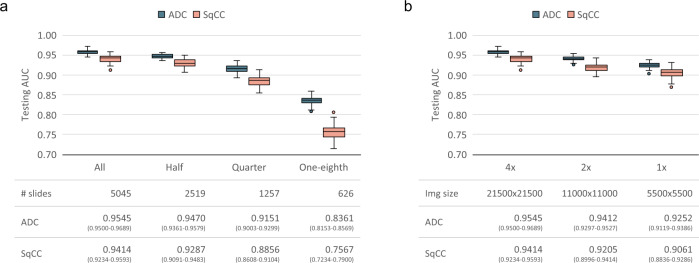
Fig. 5. Data set size and image resolution impact on whole-slide training method.
The performances were measured by area under the ROC curve (AUC) of classifying adenocarcinoma (ADC, dark blue box-and-whiskers) and squamous cell carcinoma (SqCC, red box-and-whiskers) over the standard testing data set (n = 1397). The AUC distribution of each configuration was obtained based on the sampled AUCs by bootstrapping over 100 iterations. A box-and-whisker is drawn to represent each distribution with center (Q2, the median AUC), bounds of box (Q1 and Q3, the first and third quartiles of AUC), bounds of whiskers (the minimal and maximal AUCs within the range obtained by adding Q2 by ±1.5 times the distance between Q3 and Q1), and outlier points (AUCs out the range). The tables below report the exact AUC without bootstrapping and the confidence interval calculated by Delong’s method of each configuration. a Performance of models trained with reduced numbers of slides. b Performance of models trained with lower image resolution.

