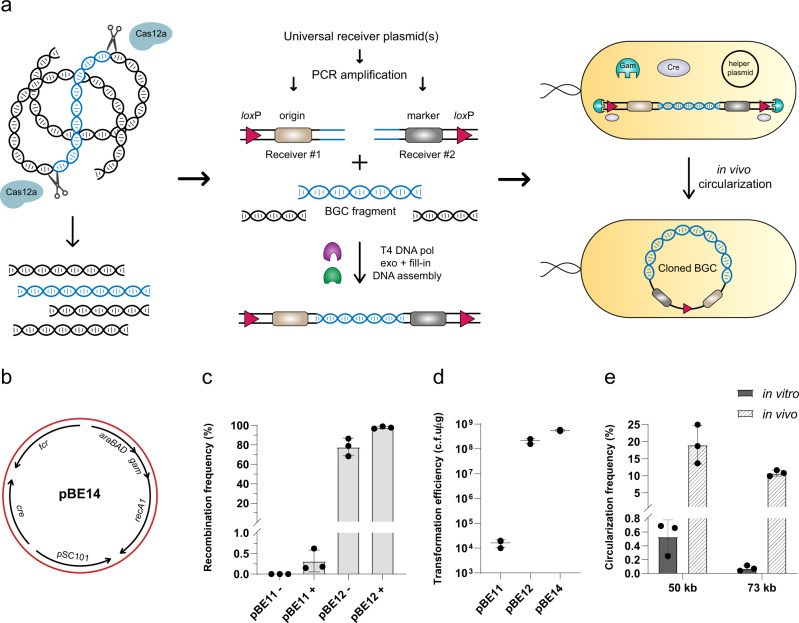
Fig. 1. Development of the CAPTURE method.
a Overview of the workflow. In the first step, purified genomic DNA is digested by Cas12a enzyme to release the target BGC fragment. In the second step, digestion products are mixed with two DNA receivers containing loxP sites at their ends. The target BGC fragment and DNA receivers are assembled together using T4 DNA polymerase exo + fill-in DNA assembly. In the final step, the assembly mixture is transformed into E. coli cells harboring a circularization helper plasmid. The linear DNA is able to circularize in vivo by Cre-lox recombination. b DNA map of helper plasmid pBE14. tcr: tetracycline resistance marker; araBAD: L-arabinose inducible promoter and its regulator; gam: phage lambda Red gam gene; pSC101: temperature-sensitive origin of replication; recA1: mutated E. coli recA gene to increase transformation efficiency. c Comparison of recombination frequency between Flp (pBE11) and Cre (pBE12) helper plasmids. -: without L-arabinose induction, +: with L-arabinose induction. Recombination frequencies were calculated based on the ratio of white colonies to the total number of acquired colonies. d Linear DNA transformation efficiency for E. coli cells harboring pBE11 (Flp), pBE12 (Cre), pBE14 (Cre and recA1) helper plasmids. Both pBE12 and pBE14 E. coli cells exhibited transformation efficiencies similar to circular DNA. e Comparison of in vitro versus in vivo circularization for two large (50 kb, 73 kb) linear DNA molecules. In vivo circularization showed ~33-fold and 150-fold higher frequency than in vitro circularization for 50 kb and 73 kb molecules, respectively. Circularization frequencies were calculated based on the number of colonies acquired for each circularization experiment in comparison to the number of colonies acquired after transformation of the original circular DNA (see Methods for full description). Each experiment was performed in three biological replicates and data are presented as mean values ± standard deviation (SD). Source data are provided as a Source Data file.

