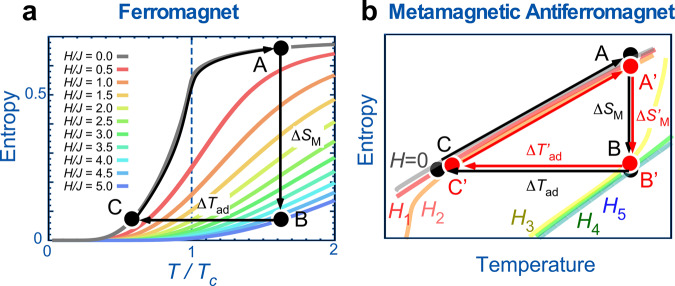
Fig. 1. Comparison between conventional ferromagnet and antiferromagnet with a metamagnetic phase transition in entropy−temperature diagram.
a Thermal variation of magnetic entropy change in typical magnetic fields (H) from H/J = 0 to H/J = 5.0 (where J is the ferromagnetic exchange constant) for ferromagnetic cases simulated in a previous theoretical study in ref. 30. The temperature is normalized to the Curie temperature TC. b Schematic illustration of magnetic refrigeration (MR) cycle for the case of antiferromagnetic (AFM) material that shows a metamagnetic phase transition. Magnetic fields are represented by zero field μ0H = 0 and finite fields H1 < H2 < H3 < H4 < H5. For the AFM case in b, the metamagnetic phase transition occurs over a small magnetic field change, ΔH = ∣H2 − H3∣, during the MR cycle A′ → B′ → C′ → A′.

