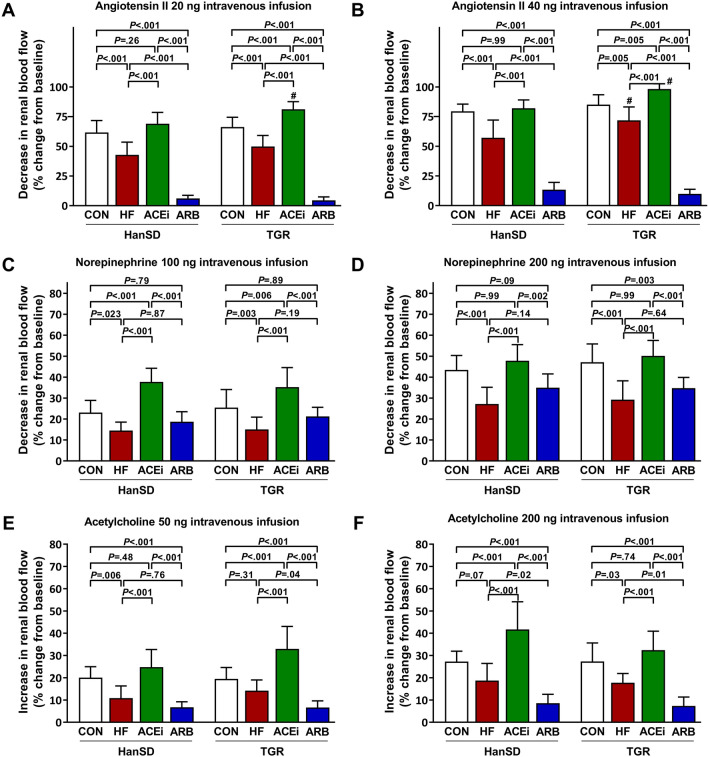
Figure 4.
Maximum changes in renal blood flow elicited by intravenous boluses of angiotensin II 20 ng (A), angiotensin II 40 ng (B), norepinephrine 100 ng (C), norepinephrine 200 ng (D), acetylcholine 50 ng (E) and acetylcholine 200 ng (F) of control (CON), untreated heart failure (HF), ACE inhibitor-treated (ACEi) and AT1 receptor blocker-treated (ARB) HanSD and TGR rats 20 weeks after sham or ACF operation (5 weeks in HF TGR rats due to high mortality). Data presented as mean ± SD (n = 10 in each group). #P < 0.05 compared to HanSD rats.

