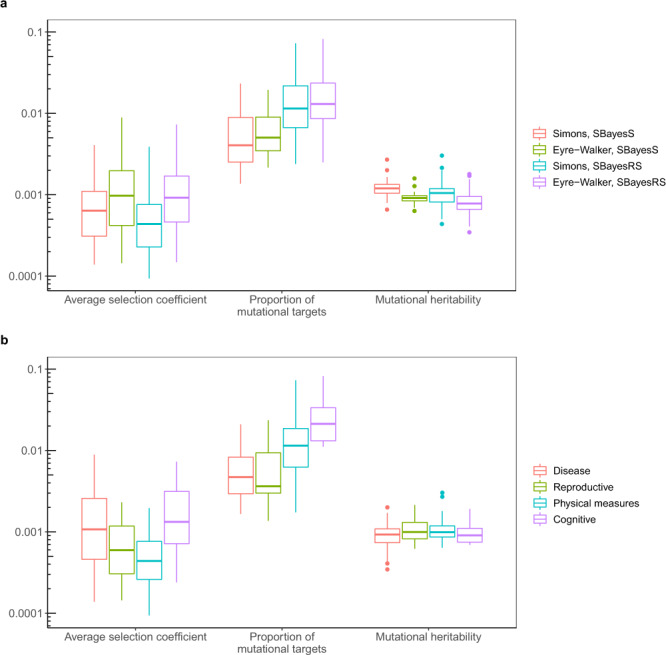
Fig. 5. Prediction of the evolutionary parameters for 44 complex traits and diseases based on a negative selection model where selection coefficients followed a mixture distribution.

a Distribution of the predicted evolutionary parameters under different scenarios: methods used for estimating the genetic architecture parameters (SBayesS and SBayesRS) and pleiotropic effect models used for simulations (the Simons et al. and Eyre-Walker model), shown by colours. Each box plot shows the results for 44 complex traits. b Distribution of predicted evolutionary parameters for four trait categories, shown by colours. Each box plot shows the results for a number of traits in a category, with each trait having four results from analyses using different estimation methods and simulation models.
