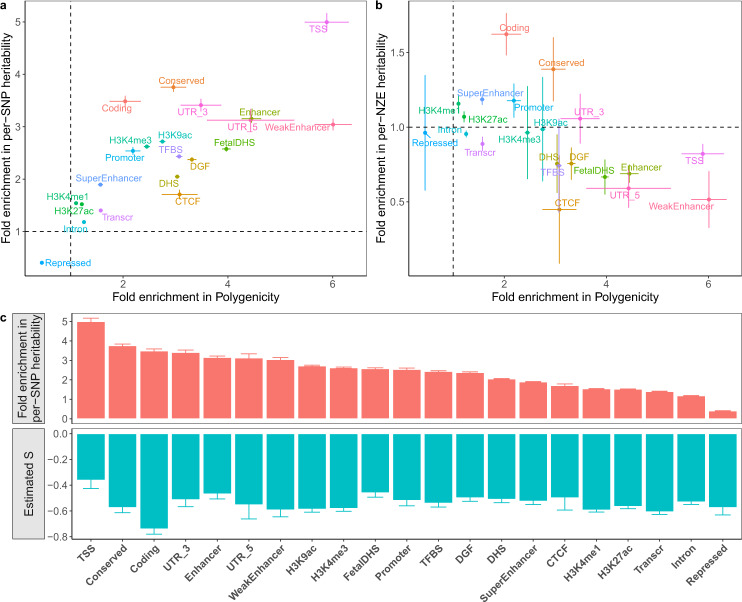
Fig. 6. Characterisation of the genetic architecture in 21 functional genomic annotation categories using the two-component SBayesS-strat model.
a Fold enrichment of per-SNP heritability against that of polygenicity. b Fold enrichment of per-NZE (per-nonzero effect) heritability against that of polygenicity. Colours indicate different annotation categories. c Estimated S (green) across annotation categories ranked by per-SNP heritability enrichment (red). Each dot or histogram is the median across 35 UKB traits (including diseases). Each bar indicates the standard error of the mean.

