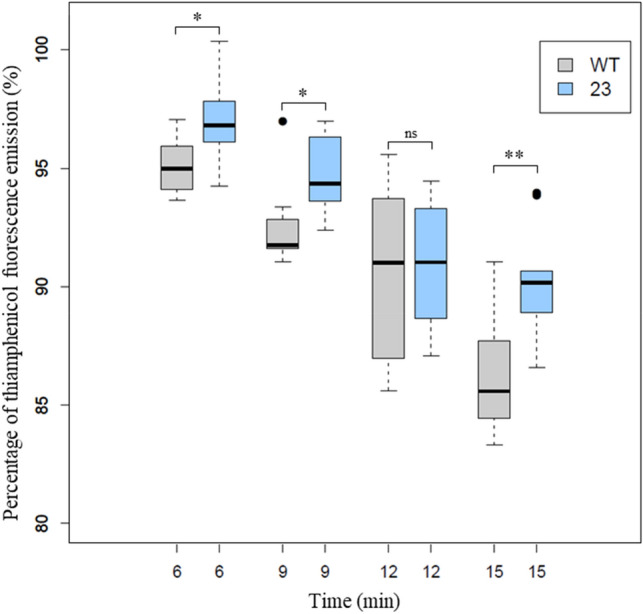
Figure 2.

Percentages of fluorescence intensities of thiamphenicol (zoomed to 80–100%) in the extracellular environment measured during the incubation of WT (grey boxes) and P23 (blue boxes) strains. The box-and-whisker plot shows the medians (“center” lines), 25th (lower section) and 75th (upper section) percentiles (interquartile range; box edges) and the span of the data for each sample (whiskers). ANOVA and Tukey’s post-hoc tests were performed to determine differences between the two strains (6 min, n = 17; 9 min, n = 18; 12 min, n = 14; 15 min, n = 18). ***p < 0.001; **p < 0.01; *p < 0.05. Data standardization was performed by the Shapiro–Wilk test, and homogeneity of variances was checked by the Fligner-Killeen test. Ns not significant. The significant difference between the two strains for the entire incubation kinetics was extremely significant p < 0.001 (ANOVA, n = 67, Cohen’s f = 0.51). Four independent experiments were performed (with technical triplicate).
