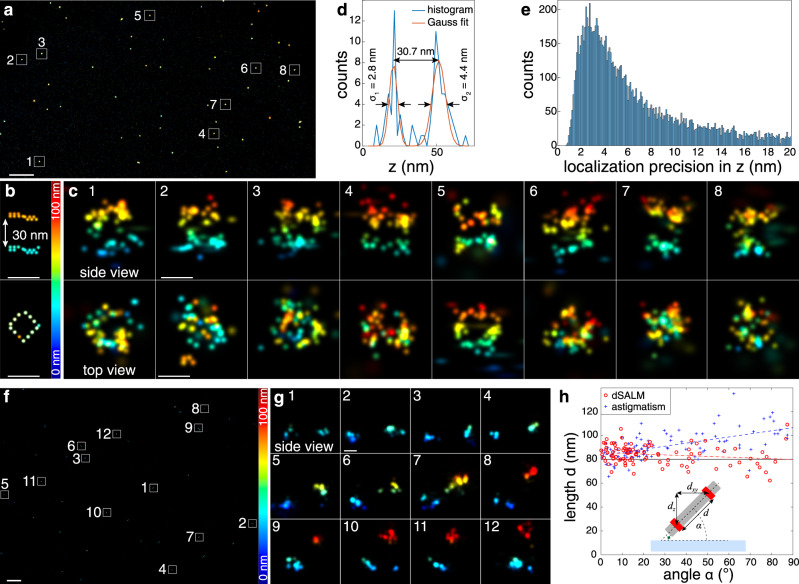
Fig. 3. Validation with DNA origamis.
a dSALM performed on 30-nm DNA origami rulers to test precision, overview image. b Schematic: each dot represents the position of a fluorophore binding site on the origami, as per design. c Side-view and top view reconstructions of the rulers corresponding to the marked regions in a. Localizations are color-coded according to their z positions (zSALM). d Axial profile through the structure c7 with Gaussian fits resulting in a standard deviation of 2.8 nm for the lower and 4.4 nm of the upper ring. The average standard deviations of all structures c1–7 are 3.2 ± 1.4 nm and 5.8 ± 1.1 nm for the lower and upper ring, respectively, and their average distance is 27.6 ± 1.6 nm. The average number of photons per localization is 21,300. e The histogram of axial dSALM localization precisions (, Eq. 7, Methods) peaks at 2.7 nm. f dSALM performed on 80-nm DNA origami rulers to test accuracy, overview image. g Side-view reconstructions corresponding to marked regions in f. h Measured length of the 80-nm DNA origami rulers in dependence on the angle shows strong depth-dependent deformations for astigmatism (blue, Pearson correlation coefficient 0.58), and much smaller deformations for dSALM (red, Pearson correlation coefficient −0.19). We measured an average length of 91.6 ± 11.5 nm with astigmatism, and 83.8 ± 8.3 nm with dSALM (N = 94, from three independent replicates). Inset: sketch of the 80-nm DNA origami ruler. Scale bars: 1 µm (a, f), 30 nm (b, c, g). Numbers denote mean ± standard deviation. Both a and f, and their respective subregions in c and g, are representative images from two (a) and three (f) independent experiments. Source Data are available as a Source Data file for Fig. 3e,h.

