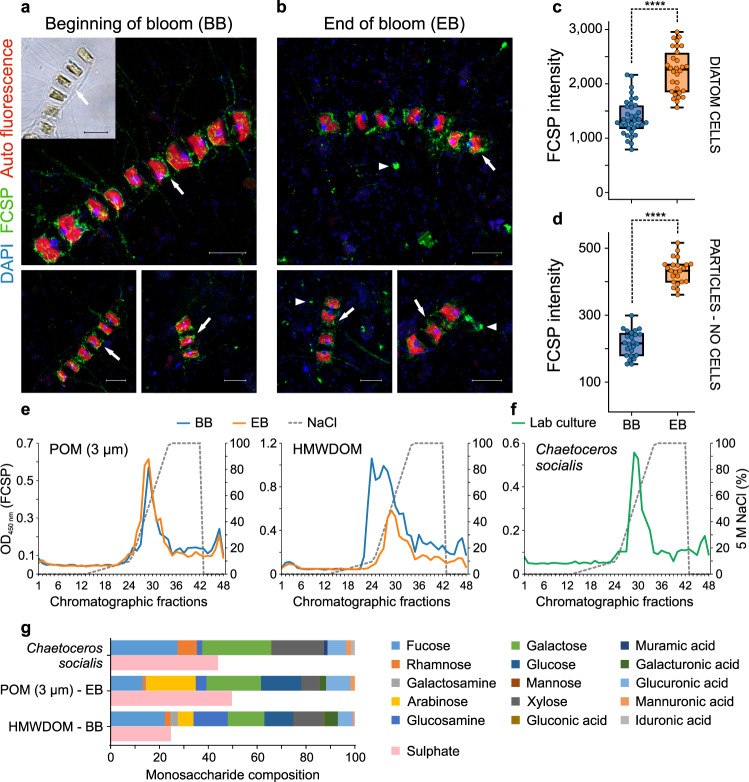
Fig. 2. Fucose-containing sulphated polysaccharide (FCSP) is produced by diatoms and increased abundance in particulate organic matter (POM) during the bloom.
Inset in panel a, bright-field image of Chaetoceros socialis cells. a, b Representative images of FCSP localisation in POM (>0.2 µm) from the diatom bloom. Airyscan super-resolution images demonstrate FCSP occurred around the cells (arrows) of the chain-forming diatom C. socialis at the beginning of the bloom (BB) (a) and on the diatoms cells (arrows) as well as on particles (arrowheads) at the end of the bloom (EB) (b). In a, b, DAPI (blue), FCSP (green) and diatom auto fluorescence (red). Scale bars, 10 µm. Experiments were performed four times with similar results. c Quantification of FCSP signal (mAb BAM1) on diatom cells. BB n = 36 cells, EB n = 30 cells. d FCSP quantification on particles (areas not containing cells). BB n = 24 areas, EB n = 23 areas. In c, d ****P < 0.0001 (two-sided t-test), in c P = 8.4 × 10⁻¹³ and in d P = 2.3 × 10⁻²³. For boxplots, the middle line indicates the median, the box designates the interquartile range (IQR) and the whiskers denote 1.5 times the IQR. e, f Chromatographic separation of FCSP in water extracts from POM and high molecular weight dissolved organic matter (HMWDOM) of beginning and end of the bloom (e) and from a lab culture of the diatom C. socialis (f) by anion exchange chromatography (AEC). AEC fractions were analysed by ELISA with the mAb BAM1. ELISA developing time was not the same for the five shown representative single FCSP separation AEC runs (four in e and one in f), thus absorbance values do not indicate extract concentration (see Methods section). Optical density (OD). Experiments (chromatography plus ELISA analyses) for BB and EB POM were performed two times per each, for BB and EB HMWDOM four times per each and for C. socialis four times, with similar results. g Monosaccharide composition of purified FCSP (AEC fraction with BAM1 absorbance peak) as mean relative abundance, n = 2 independent acid hydrolysis and HPAEC-PAD runs. See FCSP monosaccharide composition of additional AEC fractions in Supplementary Fig. 6b. Sulphate content (n = 2 technical replicates) of each purified FCSP sample as µM sulphate per µM total building blocks.

