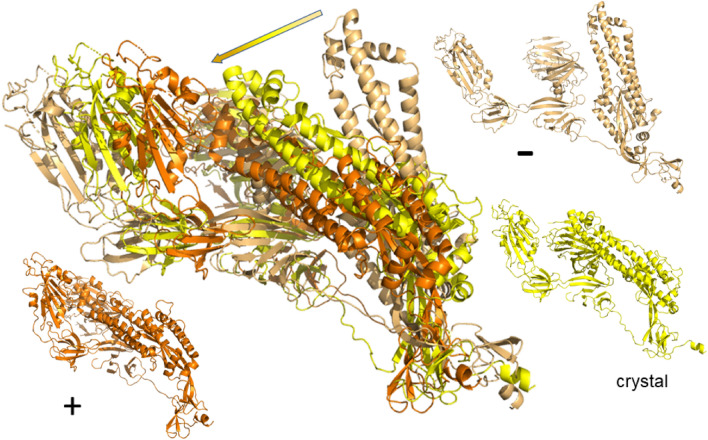
Figure 3.
Example of flexible motion for mode of the SARS-CoV-2 spike ecto domain (PDB: 6vxx) monomer at with chain A denoted by yellow with its extreme structural positions superimposed and colored light orange/orange. The arrow indicates the range of movement for the dominant -helix structure in the spike ecto domain, from negative to positive movement. The smaller protein structures surrounding the large one show the initial (crystal) structure as well as the extremes (, –) along the possible motion directions for in the same colors as in the superimposed structure.

