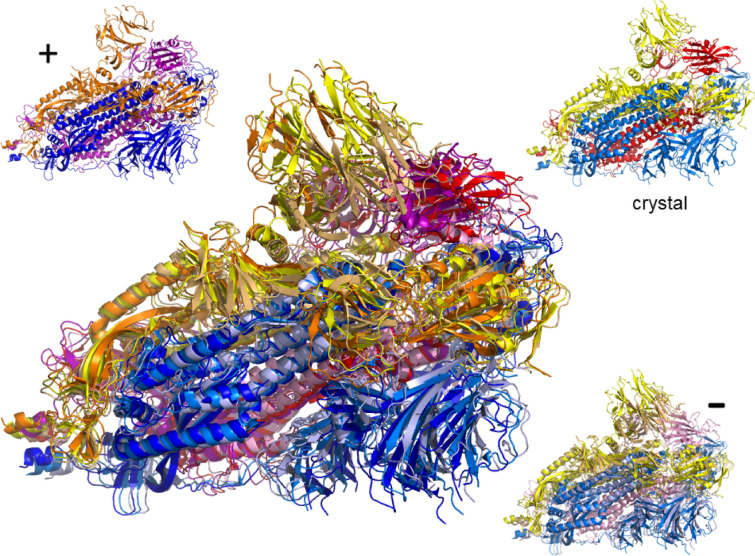
Figure 6.
Side views of motion in the spike ecto domain in closed configuration (6vxx)9 for motion at for the whole trimer. The secondary protein structure is highlighted by the chosen “cartoon” representation. As in Fig. 5, colors yellow, blue and red denote chains A, B, and C, respectively, while color combinations light orange/orange, pink/purple and light blue/dark blue show the extreme structural positions for the movements along . The smaller protein structures show the initial (crystal) structure as well as the extremes (, –) along in the same colors as in the superimposed structure.

