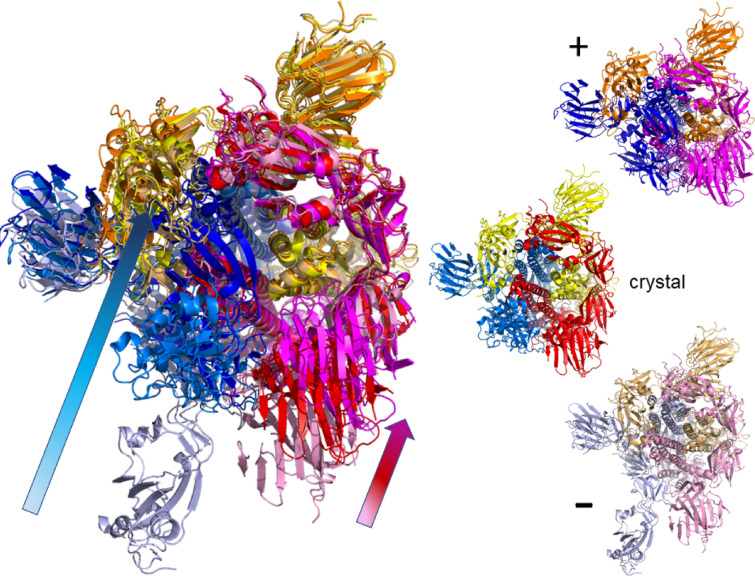
Figure 7.
Possible motion along mode at in the open spike ecto domain (6vyb)9 when in view from the top. Colors for the superimposed structure are chosen identical to Figs. 5 and 6. As in Fig. 3, the arrows indicate the range of motion for chain B (blue shades) and also for chain C (reds). The initial (crystal) structure as well as the extremes (, –) along in the same colors as in the superimposed structure are shown in the three smaller proteins.

