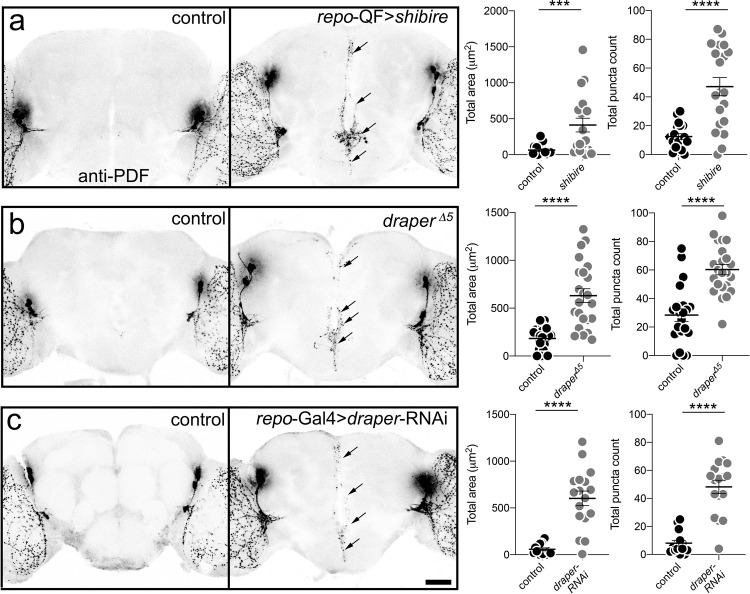
Fig. 2. Central PDF-Tri neuron elimination requires Draper-dependent glial clearance.
a Whole brains labeled with anti-PDF in transgenic glial driver control (repo-QF/+, left) and with dominant-negative shibirets expressed in glia (repo-QF > shibirets, right). PDF-Tri neurons (arrows) absent in controls, but persist when glial phagocytosis is blocked. Brains at 2 DPE, raised at 30 °C. Right: Graphs showing central PDF-Tri area (left) and PDF+ puncta (right) in the two genotypes. Area: Two-sided Mann–Whitney, p = 0.0006, 63.52 ± 17.21 n = 18 control, 412.3 ± 95.91 n = 19 glial shibirets. Puncta: Two-sided t test, p < 0.0001, 12.42 ± 2.012 n = 19 control, 47.15 ± 6.34 n = 20 glial shibirets. b Brains labeled with anti-PDF in genetic background control (w1118) and draper null (draper∆5). PDF-Tri neurons absent in controls, but persist when Draper activity is blocked. Brains at 5 DPE, raised at 25 °C. Right: Graphs show anti-PDF area (right) and PDF+ puncta (left). Area: Two-sided t test, p < 0.0001, 183.1 ± 26.78 n = 21 control, 631 ± 71.56 n = 23 draper. Puncta: two-sided Mann–Whitney, p < 0.0001, 28.36 ± 4.385 n = 22 control, 60.26 ± 3.661 n = 23 draper. c PDF-labeled brains in transgenic control (repo-Gal4/+) and with draper-RNAi in glia (repo-Gal4 > draper-RNAi). Right: Graphs show anti-PDF area (right) and puncta (left). Area: two-sided t test, p < 0.0001, 58.24 ± 14.41 n = 16 control, 602.03 ± 78.46 n = 17 draper-RNAi. Puncta: Two-sided t test, p < 0.0001, 8 ± 2.04 n = 15 control, 48.24 ± 4.746 n = 17 draper-RNAi. Scatter plot graphs show mean ± SEM. Sample size is n = number of animals. Significance shown for p < 0.001 (***) and p < 0.0001 (****). Scale bar: 50 μm. Source data for this figure are provided in Source Data file.

