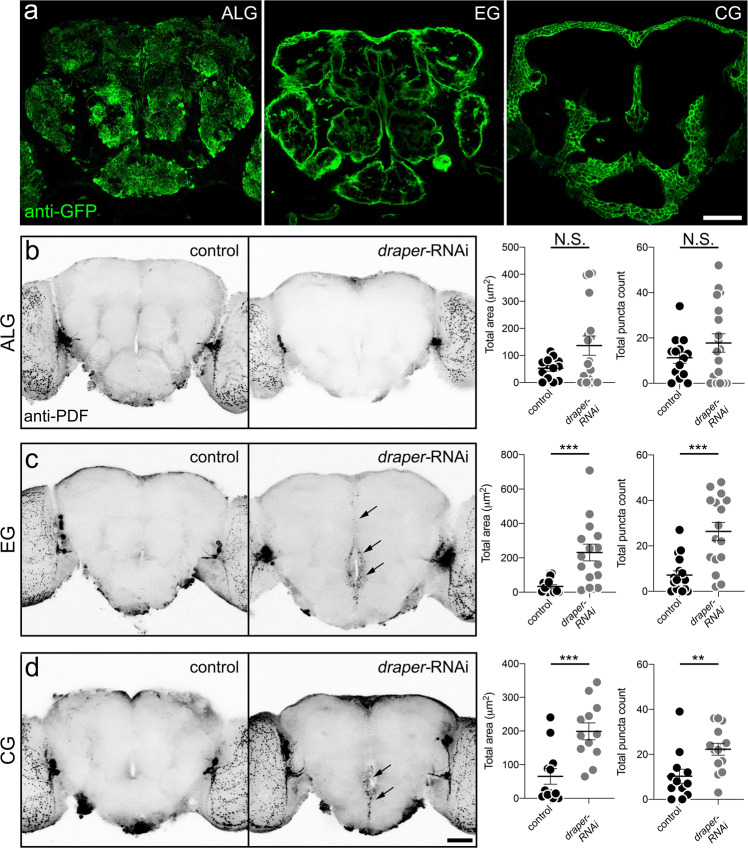
Fig. 3. Central PDF-Tri neuron elimination requires both ensheathing and cortex glia.
a Brains expressing membrane-tethered mCD8::GFP in glial classes: (1) astrocyte-like glia (ALG, R86E01-Gal4 > mCD8::GFP, left), (2) ensheathing glia (EG, R56F03-Gal4 > mCD8::GFP, middle), and (3) cortex glia (CG, R54H02-Gal4 > mCD8::GFP, right). Images are representative of three independent experiments. b 5 DPE brains labeled with anti-PDF in ALG driver control (R86E01-Gal4/+) and expressing draper-RNAi (R86E0-Gal4 > draper-RNAi). Right: Graphs show anti-PDF area (left) and puncta (right). Area: Two-sided t test, p = 0.0622, 52.55 ± 10.6 n = 13 control, 136.3 ± 35.71 n = 18 draper-RNAi. Puncta: Two-sided t test, p = 0.214, 11.29 ± 2.471 n = 14 control, 17.78 ± 4.068 n = 18 draper-RNAi. c EG driver control (R56F03-Gal4/+) and draper-RNAi (R56F03-Gal4 > draper-RNAi). PDF-Tri neurons (arrows) absent in controls, but persist with Draper activity blocked. Right: Graphs show area (left) and puncta (right). Area: Two-sided t test, p = 0.0003, 33.65 ± 10.14 n = 16 control, 230.8 ± 48.787 n = 15 draper-RNAi; Puncta: Two-sided Mann–Whitney, p = 0.0003, 7.176 ± 1.867 n = 17 control, 26.38 ± 3.936 n = 16 draper-RNAi. d CG driver control (R54H02-Gal4/+) and draper-RNAi (R54H02-Gal4 > draper-RNAi). Right: Graphs show area (left) and puncta (right). Area: Two-sided t test, p = 0.0008, 65.11 ± 23.33 n = 12 control, 199 ± 25.09 n = 12 draper-RNAi; Puncta: Two-sided Mann–Whitney, p = 0.0039, 10.25 ± 3.148 n = 12 control, 22.29 ± 2.653 n = 14 draper-RNAi. Scatter plot graphs: mean ± SEM. Sample size is n = number of animals. Significance: p > 0.05 (not significant, N.S.), p < 0.01 (**), p < 0.001 (***), and p < 0.0001 (****). Scale bar: 50 μm. Source data for this figure are provided in Source Data file.

