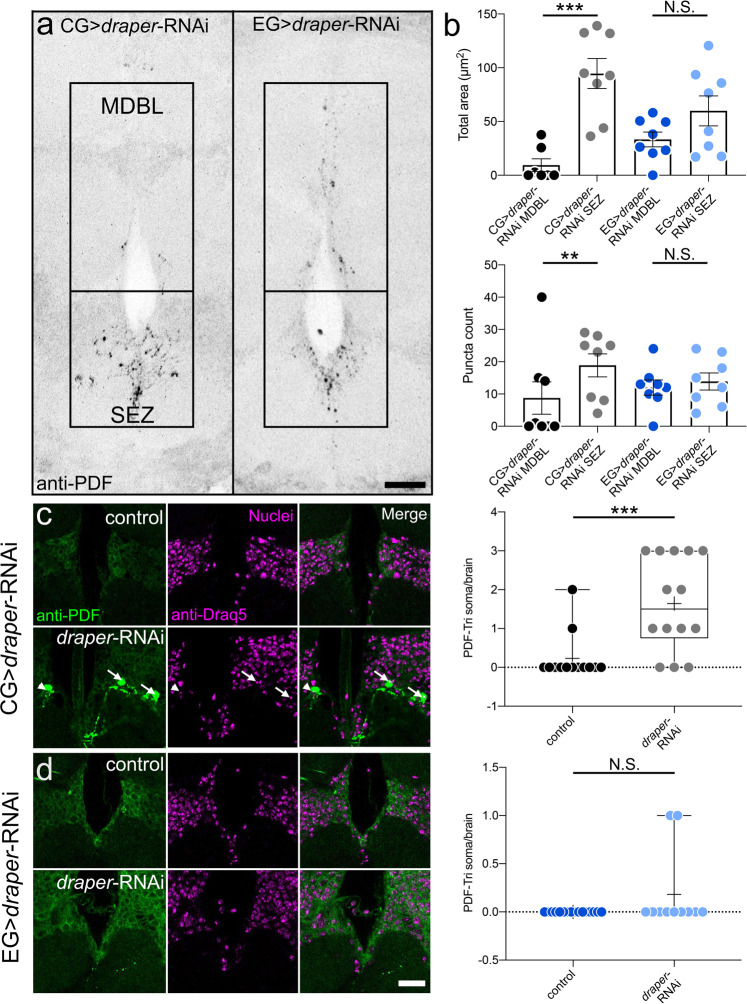
Fig. 4. Cortex and ensheathing glia clear PDF-Tri neurons in spatially restricted domains.
a Brain midline labeled with anti-PDF at 5 DPE with cortex glia-driven draper-RNAi (CG, R54H02-Gal4 > draper-RNAi, left) or ensheathing glia-driven draper-RNAi (EG, R56F03-Gal4 > draper-RNAi, right). Boxed regions are the distal medial bundle (MDBL) or proximal subesophageal zone (SEZ). Scale bar: 25 μm. Images are representative of two independent experiments. b Quantification of anti-PDF area (top) or puncta (bottom) comparing MDBL and SEZ with CG > draper-RNAi (left, black/gray) and EG > draper-RNAi (right, blue/light blue). Area: CG > draper-RNAi, Two-sided Mann–Whitney, p = 0.0006, 26.61 ± 17.89 n = 7 MDBL, 94.62 ± 13.93 n = 8 SEZ. EG > draper-RNAi, Two-sided t test, p = 0.1084, 33.33 ± 6.844 n = 8 MDBL, 59.89 ± 13.89 n = 8 SEZ. Puncta: CG > draper-RNAi, two-sided Mann–Whitney, p = 0.0079, 4.28 ± 2.643 n = 7 MDBL, 18.88 ± 3.573 n = 8 SEZ. EG > draper-RNAi, Two-sided t test, p = 0.6049, 12.00 ± 2.360 n = 8 MDBL, 13.88 ± 2.642 n = 8 SEZ. c Brain slices from 5 DPE control (CG, R54H02-Gal4/+, top) and draper-RNAi (CG, R54H02-Gal4 > draper-RNAi) labeled with anti-PDF (green, left), nuclear anti-Draq5 (magenta, middle) and merge (left). Arrows indicate colocalized ant-PDF and -Draq5 (PDF-Tri soma). Arrowhead indicates PDF-Tri neuron slightly out of plane. Right: Quantification of PDF-Tri neuron cell bodies per brain. Two-sided Mann–Whitney, p = 0.0009, 0.2308 ± 0.1662 n = 13 control, 1.643 ± 0.3249 n = 14 draper-RNAi. d Brain slices from 5 DPE control (EG, R56F03-Gal4/+, top) and draper-RNAi (EG, R56F03-Gal4 > draper-RNAi) labeled with anti-PDF (green, left), nuclear anti-Draq5 (magenta, middle) and merge (left). Scale bar: 25 μm. Right: Quantification of PDF-Tri neuron cell bodies per brain. Two-sided Mann–Whitney, p = 0.1567, 0.000 ± 0.000 n = 16 control, 0.1818 ± 0.1220 n = 11 draper-RNAi. Scatter plots show mean ± SEM. Box and whisker plots show quartiles with max and min values, with plus sign indicating the mean. Sample size is n = number of animals. Significance: p > 0.05 (not significant N.S.), p < 0.01 (**), and p < 0.001 (***). Source data for this figure are provided in Source Data file.

