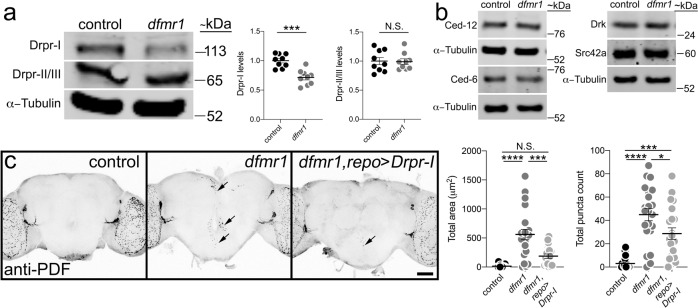
Fig. 6. FMRP positively regulates Draper-I levels to drive PDF-Tri neuron elimination.
a Representative anti-Draper Western blot of whole-brain lysates (2 brains per lane, 0 DPE) for control (w1118) and dfmr1 null (w1118; dfmr150M). All bands labeled on the left: Draper-I (Drpr-I, top), Draper-II/III (Drpr-II/III, middle), and α-tubulin (bottom). Molecular weights listed on the right (~kDa). Right: Graphs showing Draper-I (left) and Draper-II/III (right) levels normalized to α-tubulin in both genotypes. Drpr-I: two-sided t test, p = 0.0001, 1.000 ± 0.03750 n = 9 control, 0.7156 ± 0.04221 n = 9 dfmr1. Drpr-II/III: two-sided t test, p = 0.9076, 1.000 ± 0.06112 n = 9 control, 0.9908 ± 0.04875 n = 9 dfmr1. Sample size is n = number of independent protein extractions (two brains/extraction). b Representative Western blots for glial engulfment proteins in control and dfmr1 null. Labels listed left, and weights on the right. Images are representative of two independent experiments (see Supplemental Fig. 5). c Whole brains (5 DPE) labeled with anti-PDF in transgenic glial driver control (repo-Gal4/+), dfmr1 null with glial driver (dfmr150M, repo-Gal4/dfmr150M), and driving UAS-Draper-I (UAS-Drpr-I/+; dfmr150M, repo-Gal4/dfmr150M). Scale bar: 50 μm. Right: Quantification of anti-PDF area (left) and puncta (right). ANOVA followed by Tukey’s multiple comparison test. Area: p < 0.0001, 14.1 ± 6.406 n = 17 control, 560.6 ± 89.03 n = 22 dfmr1; p = 0.152, 14.1 ± 6.406 n = 17 control, 187.4 ± 37.5 n = 17 UAS-Drpr-I; p = 0.0002, 560.6 ± 89.03 n = 22 dfmr1, 187.4 ± 37.5 n = 17 UAS-Drpr-I. Puncta: 3.0 ± 5.347 p = 18 control, 44.95 ± 5.211 n = 22 dfmr1; p = 0.0006, 3.0 ± 5.347 n = 18 control, 28.67 ± 4.981 n = 21 UAS-Drpr-I; p = 0.00272, 44.95 ± 5.211 n = 22 dfmr1, 28.67 ± 4.981 n = 21 UAS-Drpr-I. Sample size is n = number of animals. Scatter plots show mean ± SEM. Significance: p > 0.05 (not significant, N.S.), p < 0.05 (*), p < 0.01 (**), p < 0.001 (***), p < 0.0001 (****). Source data for this figure are provided in Source Data file.

