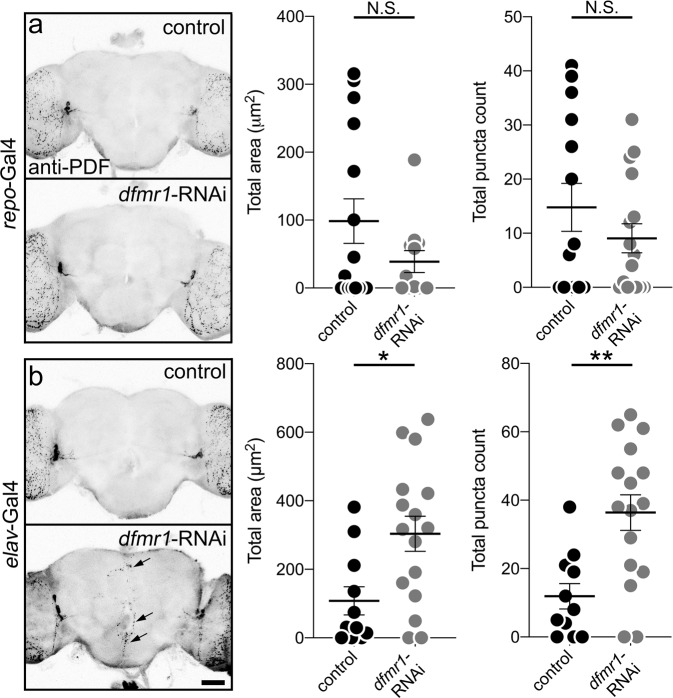
Fig. 7. FMRP is required specifically within neurons for PDF-Tri neuron elimination.
a Whole brains (5 DPE) labeled with anti-PDF in transgenic glial driver control (repo-Gal4/+, top) and expressing dfmr1-RNAi targeted to glia (repo-Gal4 > dfmr1-RNAi35200, bottom). Both genotypes exhibit a lack of PDF-Tri neurons in the central brain. Right: Graphs showing central PDF-Tri area (left) and PDF+ puncta (right) in the two genotypes. Area: two-sided Mann–Whitney, p = 0.5700, 98.62 ± 32.84 n = 15 control, 38.84 ± 16.17 n = 12 dfmr1-RNAi; puncta: two-sided t test, p = 0.2650, 14.79 ± 4.432 n = 14 control, 9.063 ± 2.676 n = 16 dfmr1-RNAi. b Brains (5 DPE) labeled with anti-PDF in the transgenic neuron driver control (elav-Gal4/+, top) and expressing dfmr1-RNAi targeted to neurons (elav-Gal4 > dfmr1-RNAi35200, bottom). The PDF-Tri neurons are absent in controls, but persist when FMRP function is removed in neurons (arrows). Right: Graphs showing anti-PDF area (left) and PDF+ puncta (right) in the two genotypes. Area: two-sided t test, p = 0.0105, 108.1 ± 40.93 n = 11 control, 303.7 ± 51.3 n = 16 dfmr1-RNAi; puncta: two-sided t test, p = 0.0018, 11.91 ± 3.706 n = 11 control, 36.38 ± 5.169 n = 16 dfmr1-RNAi. Scatter plot graphs show mean ± SEM. Sample size is n = number of animals. Significance shown for p > 0.05 (not significant, N.S.), p < 0.05 (*), and p < 0.01 (**). Scale bar: 50 μm. Source data for this figure are provided in Source Data file.

