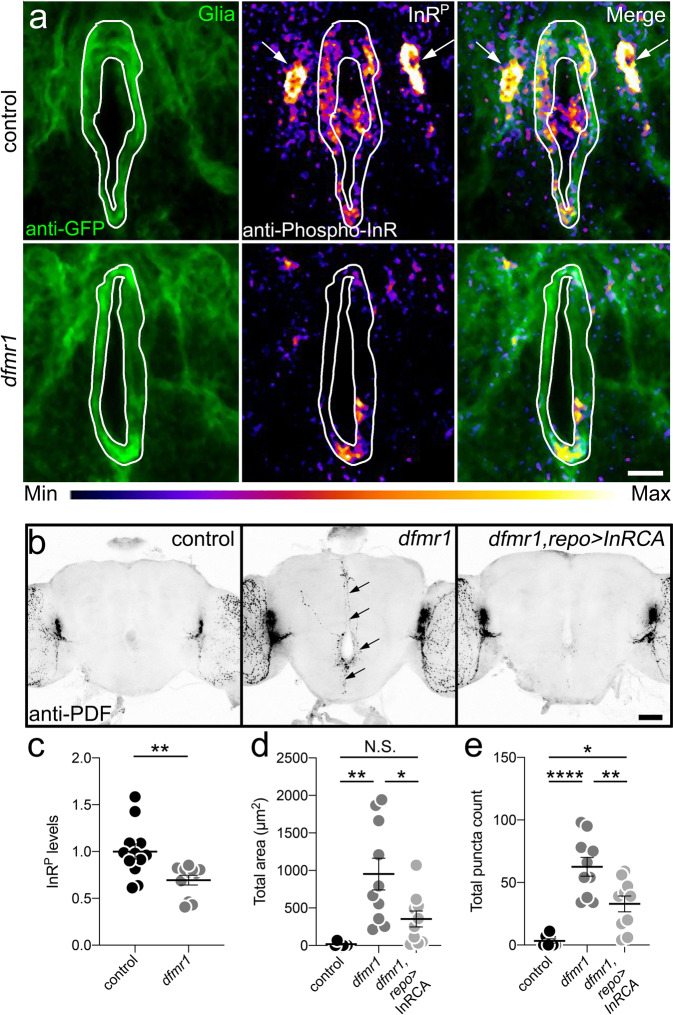
Fig. 9. FMRP drives glial insulin receptor activation to mediate PDF-Tri neuron clearance.
a Central brains (2 DPE) co-labeled for glial mCD8::GFP (left), anti-phosphorylated insulin receptor (InRP, middle), and merge (right) in the control (UAS-mCD8::GFP/+; repo-Gal4/+) and dfmr1 null (UAS-mCD8::GFP/+; dfmr150M, repo-Gal4/dfmr150M). White outline indicates glial area used for InRP measurements; arrows indicate glial cell bodies. Range indicator bar for InRP intensity level below. Scale bar: 10 μm. b Whole brains (5 DPE) anti-PDF labeled in glial driver control (repo-Gal4/+), dfmr1 null with driver (dfmr150M, repo-Gal4/dfmr150M), and InRCA targeted to glia (UAS-InRdel/+; dfmr150M, repo-Gal4/dfmr150M). PDF-Tri neurons (arrows) in dfmr1 null. Scale bar: 50 μm. c Quantification of normalized InRP levels from panel a. Two-sided t test, p = 0.0054, 1.00 ± 0.0815 n = 12 control, 0.694 ± 0.0521 n = 11 dfmr1. d Quantification of the PDF-Tri area from panel b. ANOVA followed by Tukey’s multiple comparison test, p = 0.0011, 18.18 ± 9.959 n = 7 control, 952.3 ± 211.9 n = 10 dfmr1; p = 0.3183, 18.18 ± 9.858 n = 7 control, 352.8 ± 105.9 n = 10 InRCA; =0.0197, 352.8 ± 105.9 n = 10 InRCA, 952.3 ± 211.9 n = 10 dfmr1. e Quantification of PDF+ puncta from panel b. ANOVA followed by Tukey’s multiple comparison test, p < 0.0001, 3.286 ± 1.686 n = 7 control, 62.6 ± 7.524 n = 10 dfmr1; p = 0.0118, 3.286 ± 1.686 n = 7 control, 32.9 ± 6.28 n = 10 InRCA; p = 0.0054, 32.9 ± 6.28 n = 10 InRCA, 62.6 ± 7.524 n = 10 dfmr1. Scatter plot graphs show mean ± SEM. Sample sized is n = number of animals. Significance shown for p > 0.05 (not significant, N.S.), p < 0.05 (*), p < 0.01 (**), and p < 0.0001 (****). Source data for this figure are provided in Source Data file.

