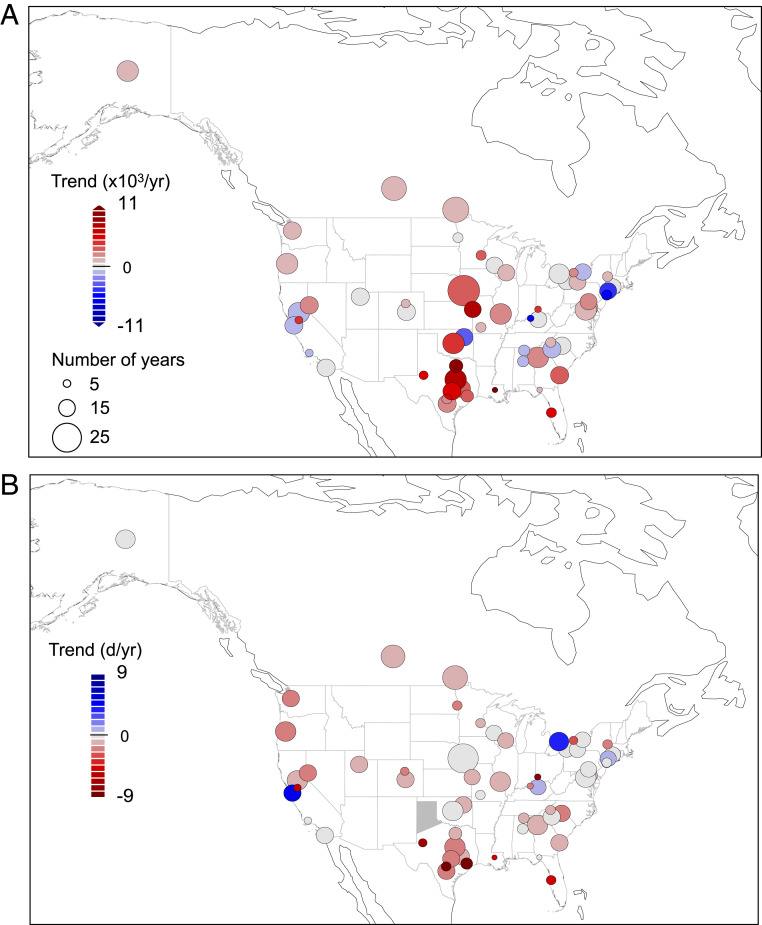
Fig. 1.
Detection of long-term worsening of pollen seasons in North America. Linear trend over individual stations of the annual pollen integrals (A) and pollen season start date (B) across the 60 pollen stations in North America. Warm colors indicate increasing annual pollen integrals or earlier start dates and circle size is proportional to the years of data at each station.

