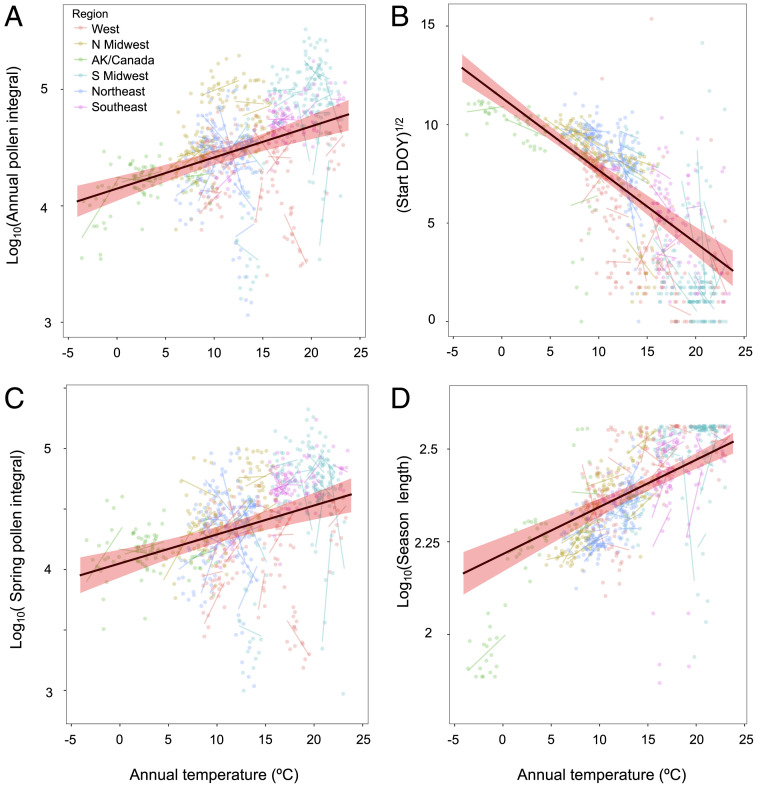
Fig. 2.
Temperature strongly influences pollen seasons and loads in North America. Predicted slope from linear mixed effects models across 60 North American cities of annual average temperature against the total annual pollen integrals (A), pollen season start date (DOY) (B), total spring (February–May) pollen integrals (C), and total pollen season length (days) (D). Points are individual years at individual stations. Thin lines are station-level trends. Point/line colors are regions (SI Appendix, Fig. S5). Shaded areas indicate the 95% CI of the fixed effect.

