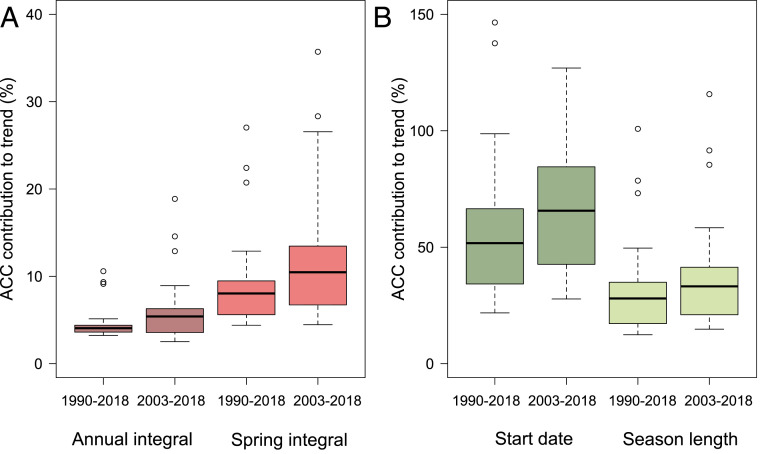
Fig. 3.
Anthropogenic climate change (ACC) has exacerbated pollen seasons. Boxplot of the percentage contribution of ACC to the long-term (1990–2018) and more recent (2003–2018) trends of annual total pollen integrals (dark red) and spring total pollen integrals (red) (A) and pollen season start date (dark green) and season length (light green) (B) across 60 pollen stations in North America. Data are plotted from 22 climate models (i.e., each model’s estimated fractional contribution to the observed continental trend from the mixed effect model).

