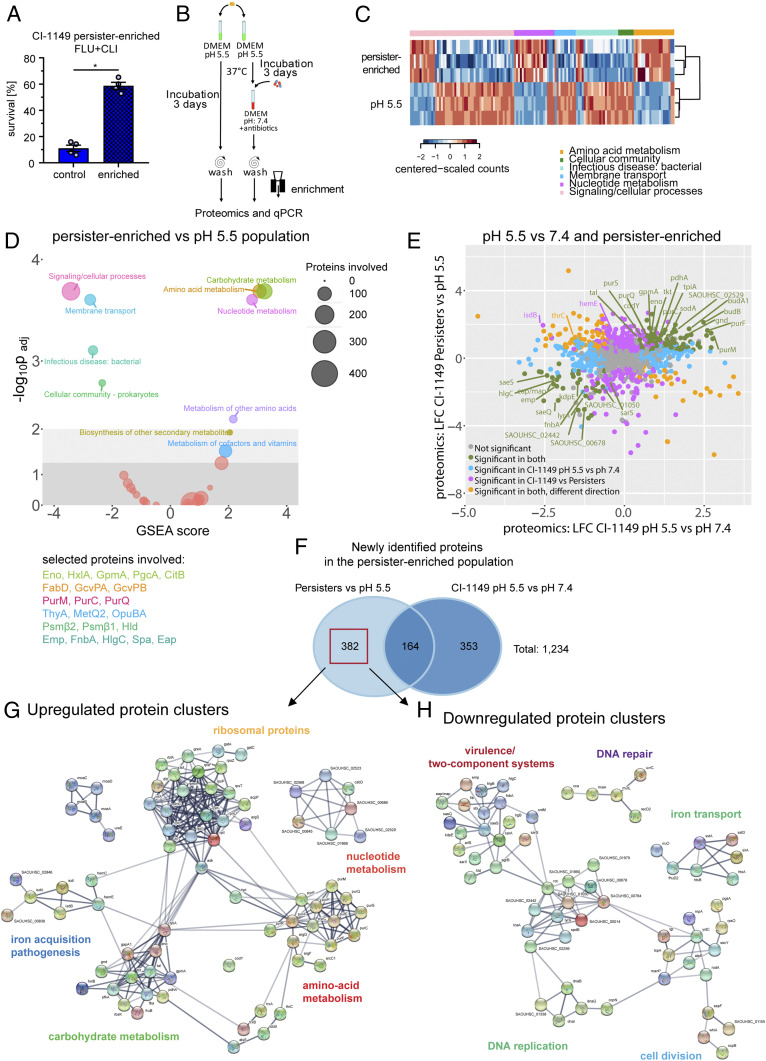
Fig. 4.
Molecular signature of a S. aureus persister-enriched subpopulation. (A) Antibiotic survival assay, involving 24 h exposure to FLU+CLI (40× MIC) for a persister-enriched population and pH 5.5-stressed bacteria. Survival was calculated relative to the initial inoculum. N = 4 biological replicates. Error bars depict SEM. (B) Scheme for MS analysis of persister-enriched S. aureus. (C) Heatmap showing three biological replicates for selected significantly enriched Kyoto Encyclopedia of Genes and Genomes (KEGG) pathways from D. (D) GSEA on KEGG pathways from persister-enriched CI-1149 vs. pH 5.5-stressed bacteria. Circles’ diameter indicates number of involved proteins. Selected proteins are displayed in the corresponding pathway color. (E) Dot plot comparing proteomic changes in persister-enriched and pH 5.5-stressed CI-1149 vs. pH 5.5 stress compared with pH 7.4 growth. LFC > 1 (log2 fold change; fold change >2), P < 0.05. (F) Venn diagram showing overlaps and uniquely identified proteomic changes in persister-enriched CI-1149 vs. pH 5.5-stressed bacteria compared with pH 5.5 vs. pH 7.4 growing bacteria. Red box indicates uniquely differentially expressed proteins in the persister-enriched population that were further analyzed via the Search Tool for the Retrieval of Interacting Genes/Proteins (STRING). (G) STRING analysis on up-regulated proteins found in the persister-enriched population identifies up-regulated protein–protein interaction networks. (H) STRING analysis on down-regulated proteins found in the persister-enriched population identifies down-regulated protein–protein interaction networks.

