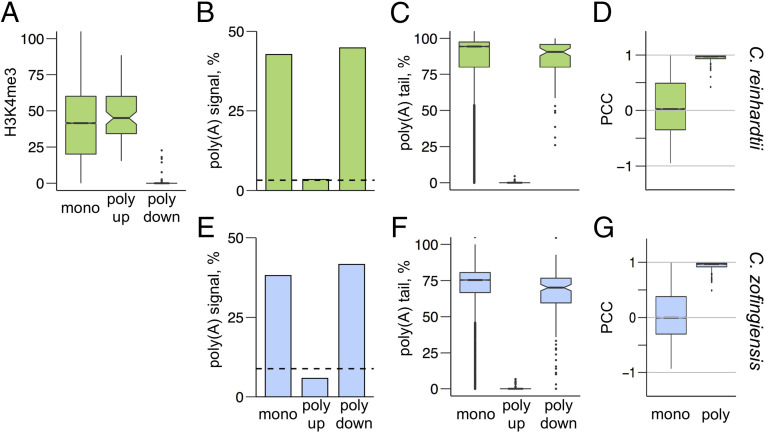
Fig. 2.
Evidence of polycistronic expression. (A) ChIP-Seq was performed on C. reinhardtii DNA with an antibody to H3K4me3 to identify transcription start sites. A score of H3K4me3 marks relative to input was calculated for each nucleotide in the genome. The mean score for the 500 nt at the 5′ end of each gene model was calculated, and the distribution of these scores is plotted as a box plot for all monocistronic (“mono,” n = 17,594), polycistronic upstream (“poly up,” n = 87), and polycistronic downstream (“poly down,” n = 87) genes. (B) The presence of a UGUAA polyadenylylation signal sequence within the final 100 nt of each computationally annotated gene model was determined for C. reinhardtii for monocistronic (n = 17,594), polycistronic upstream (n = 87), and polycistronic downstream (n = 87) genes. The expected frequency of that sequence within a random 100-nt sequence with the same GC content is plotted as a dashed line. (C) Poly(A) tails were identified by the presence of eight or more sequential A’s in the Iso-Seq reads. The coverage of poly(A)-containing reads was compared with the total coverage of Iso-Seq reads within the 3′-terminal 1,000 nt of each gene model. The distribution of this poly(A)-containing coverage for genes with ≥10 Iso-Seq reads is plotted in box plots for monocistronic (n = 11,658), polycistronic upstream (n = 79), and polycistronic downstream (n = 83) genes for C. reinhardtii. (D) Colinear gene pairs (adjacent genes on the same strand of the same chromosome with ≤20,000 nt between ORFs) were identified, and a Pearson's correlation coefficient (PCC) was calculated for each gene pair across a range of RNA-Seq samples. The distributions of PCC values for C. reinhardtii for monocistronic (n = 10,884) and polycistronic (“poly,” n = 84) gene pairs are plotted as a box plot. (E) An analysis of poly(A) signal sequences was performed on C. zofingiensis for monocistronic (n = 13,585), polycistronic upstream (n = 173), and polycistronic downstream (n = 173) genes as in B. (F) An analysis of poly(A) tailing was performed on C. zofingiensis for monocistronic (n = 11,476), polycistronic upstream (n = 142), and polycistronic downstream (n = 150) genes as in C. (G) An analysis of coexpression was performed on C. zofingiensis for monocistronic (n = 12,284) and polycistronic (n = 215) gene pairs as in D. For box plots, whiskers indicate 1.5 times the interquartile range, and notches indicate the confidence interval of the median. Outliers are plotted as individual points.

