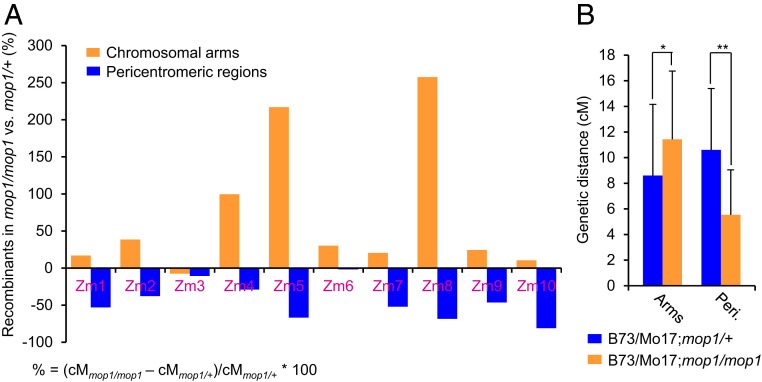
Fig. 2.
Meiotic recombination rates were increased in chromosomal arms but deceased in pericentromeric regions in mop1. (A) The changes of recombination rates in different genomic regions when comparing B73/Mo17;mop1/mop1 and B73/Mo17;mop1/+ in the 10 maize chromosomes. The y axis represents the percent change in recombination in B73/Mo17;mop1/mop1 compared with B73/Mo17;mop1/+. % = (cMmop1/mop1 – cMmop1/+)/cMmop1/+ × 100. The x axis represents the 10 maize chromosomes. (B) Comparison of the average genetic distance (cM) in B73/Mo17;mop1/mop1 and B73/Mo17;mop1/+ intervals. *P < 0.05; **P < 0.01. Student’s paired t test.

