Fig. 2.
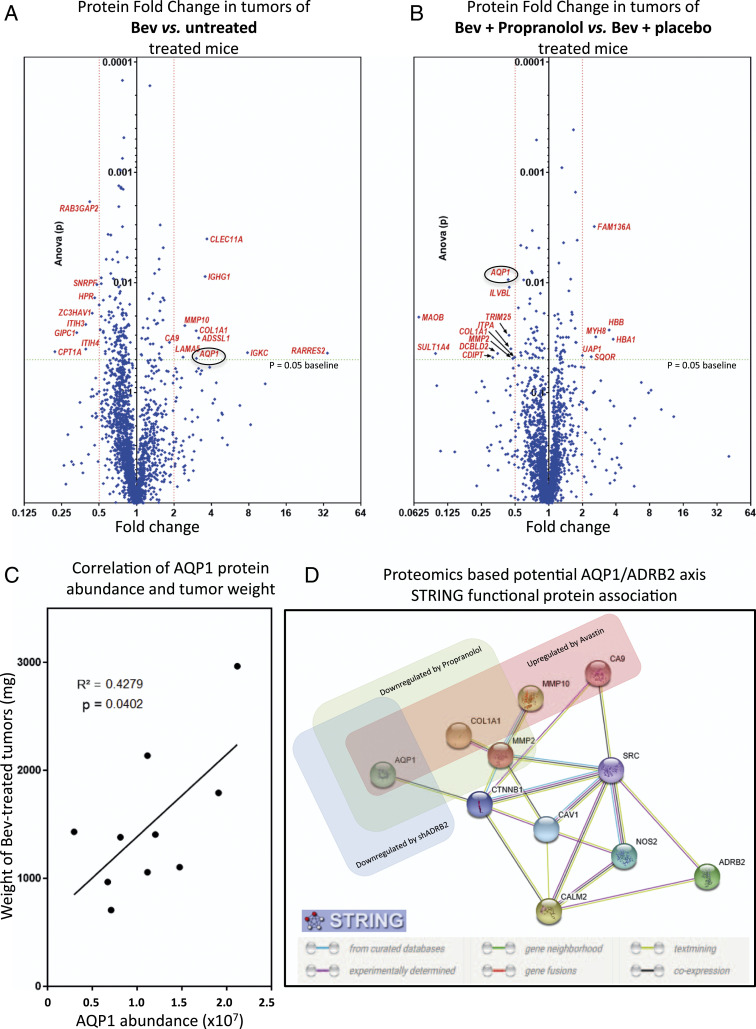
AQP1 is up-regulated in Bev-treated tumors but down-regulated when propranolol is added. (A and B) U87-MG tumor xenografts treated with placebo only, Bev + placebo, or combined Bev and propranolol were subjected to proteomic analysis. Volcano plots show a comparison of fold change protein levels between placebo- and Bev-treated xenografts (A) and Bev + placebo– and combined (Bev + propranolol)-treated xenografts (B). Proteins with a mean protein abundance altered by a factor of two or more and P > 0.05 (ANOVA) have their name in red. The protein with the most statically different mean abundance when propranolol was added was AQP1. (C) Pearson correlation analysis showing a significant positive correlation between AQP1 protein abundance and tumor weight (milligrams) in Bev-treated mice. The calculation of protein abundance (sum of the volume of corresponding human peptides) is shown. (D) Potential ADRB2-AQP1 interaction network. STRING functional protein association, based on proteome data of nontreated, Bev-treated, Bev plus propranolol-treated U87 tumors, as well as proteomic data from Bev-treated xenografts, formed by shCT- and shADRB2-transduced U87. Proteins significantly up-regulated in Bev-treated U87 tumors are boxed in red. Proteins significantly down-regulated in xenografts treated with Bev plus propranolol are boxed in green. Proteins significantly down-regulated in Bev-treated xenografts formed by transplantation of shADRB2-transduced U87 are boxed in blue. MMP10 = matrix metalloproteinase 10; MMP2 = type IV collagenase (angiogenesis); CTNNB1 = β-catenin; CAV1 = Caveolin-1; CALM2 = Calmodulin-2; NOS2 = nitric oxide synthase, inducible. The STRING consortium database 2017 of known and predicted protein-protein interactions was used for interaction network prediction.

