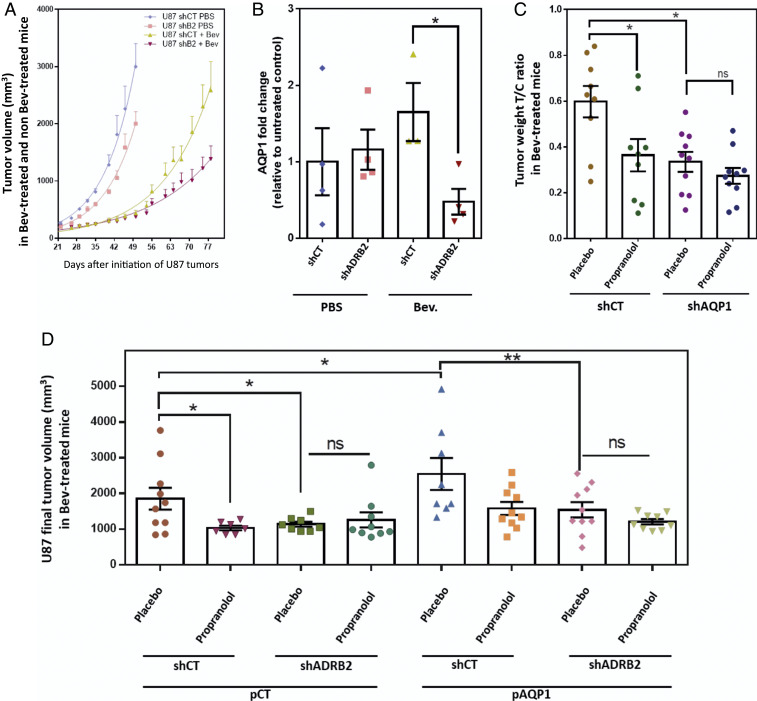
Fig. 3.
ADRB2-AQP1 axis in propranolol antitumor response using U87 cells transduced with shCT, shADRB2, shAQP1, pCT, and pAQP1 were transplanted into NSG mice. (A) Xenograft tumors of shCT or shADRB2 U87-transduced cells were subjected to periodic measurements of tumor volume in Bev- and non–Bev-treated mice. (B) Collected tumors from shCT or shADRB2 U87-transduced cells were subjected to proteomic analysis. The AQP1 level was compared among the groups. Data are presented as mean with SEM relative to untreated control abundance. The calculation of protein abundance (sum of the volume of corresponding human peptides) is shown. (C) Xenograft tumors of U87-transduced cells with shCT or shAQP1. Antitumor growth activities of propranolol and shAQP1 were evaluated by the T/C ratio, which was calculated according to the following equation: T/C ratio= tumor weight of Bev-treated mouse/mean tumor weight of counterpart non–Bev-treated control mice (same shRNA). (D) Xenograft tumors of U87 cells transduced with shCT or shADRB2 and pCT or pAQP1 overexpression vector. Final tumor volumes were compared at day 85, expressed as mean ± SEM. Statistical analysis was performed with one-way ANOVA with uncorrected Fisher’s LSD. n = 10 mice per group; *P < 0.05, **P < 0.005; ns, not significant.

