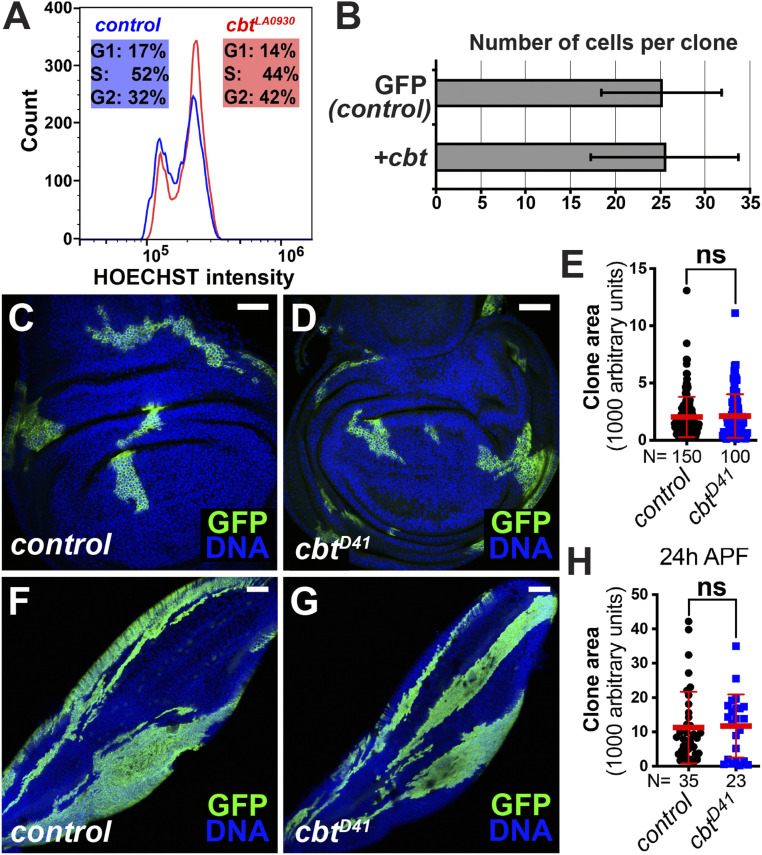
Fig. 3.
Cbt promotes G1/S progression in proliferating cells. (A and B) GFP+-labeled clones (green) expressing cbt were induced at 48 h AED by hs-flp;act > CD2 > Gal4 and analyzed at the third-larval instar. (A) Cells expressing cbt (cbtLA0930) were shifted from G1 and S phase to G2, relative to GFP− control cells. Cell counts per experiment were ∼10,000. Samples were run on a Cytoflex flow cytometer. (B) cbt expression (UAS-cbt) did not cause an increase number of cells per clone compared to wild-type controls. (C–H) cbtD41/D41 mutant clones were generated by MARCM system at 48 h AED and analyzed in the third-instar wing discs (C–E) or 24-h APF wings (F–H). Representative images showed the clone areas of wild-type control (C and F) and cbtD41/D41 mutant (D and G). Clones were labeled by GFP. Nuclei were stained with DAPI (blue). (E and H) Quantification of MARCM clone areas (mean ± SD, t test, nonsignificant [ns] P > 0.05). Each dot represents one sample. (Scale bars, 40 μm in C and D; 80 μm in F and G.)

