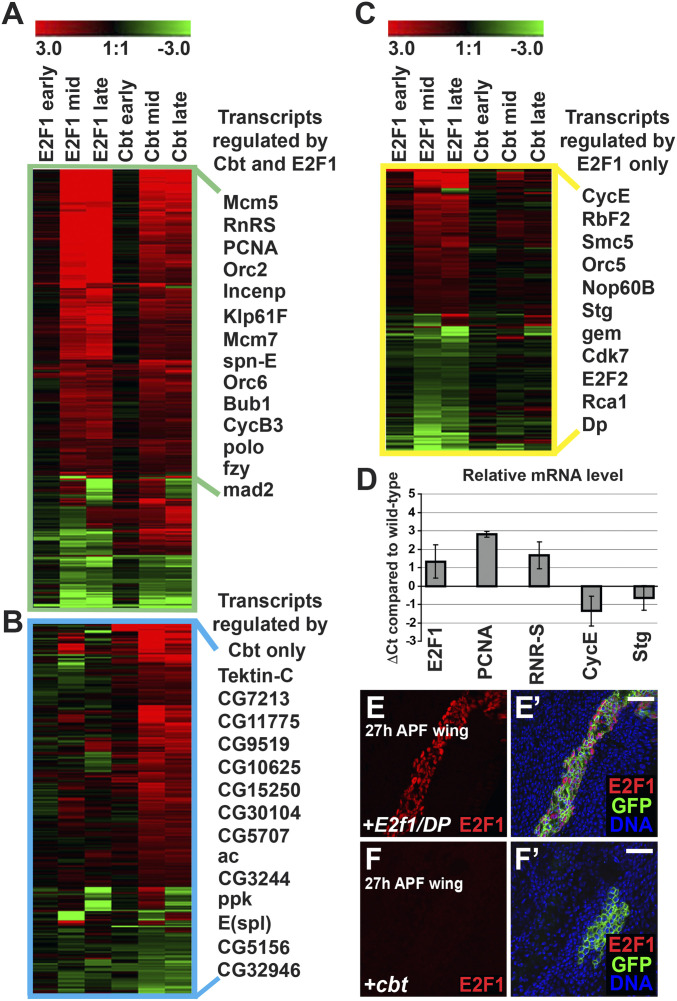
Fig. 5.
Cbt and E2F1 regulate a shared set of cell cycle genes. (A–C) Microarray analysis of gene expression in cbt or E2f1/DP expressing wings by ap-Gal4;tub-Gal80ts compared to controls (y, w, hs-flp). Heatmaps show transcript changes (color range indicates the log2 ratio of expression compares to controls). Transcripts were hierarchically clustered using Genesis software and with representative transcripts to the right. (A) Heatmap of the 334 transcripts significantly regulated by both E2F1/DP and Cbt. All transcripts with a fold-change of 1.3 or more (log2 ± 0.4, P < 0.05) at both 24 h (mid) and 36 h (late) APF time points are shown. (B) Heatmap of the 279 transcripts regulated by Cbt with a fold-change of 1.3 or more (log2 ± 0.4, P < 0.05) at both time points but not by E2F1/DP. (C) Heatmap of 200 of the >2,000 transcripts regulated by E2F1/DP with a fold-change of 1.3 or more (log2 ± 0.4) but not by Cbt at both time points. (D) RT-qPCR quantification of gene expression in wings expressing cbt compared to controls. Cbt was induced at 0 h APF by ap-Gal4;tub-Gal80ts and levels of transcript expression at 30 h APF was quantified by the ΔΔCt method (97). Wild-type expression at 30 h APF is equivalent to 0Ct while comparative changes in transcript level in cbt expressing wings was measured by ΔCt, equivalent to the log2 of the difference in transcript level. ΔCt values represent the average of three biological replicates and error bars demonstrate the range. (E–F′) GFP marked clones generated by hs-flp;tub > Gal4;tub-Gal80ts expressing E2f1/DP (E and E′) or cbt (F and F′) analyzed in 27-h APF wings. Overexpression of E2f1/DP strongly increased E2F1 protein detected by immunofluorescence (red), whereas overexpression of cbt did not. Nuclei were counter stained with Hoechst 33258 (blue). (Scale bars, 20 μm.)

