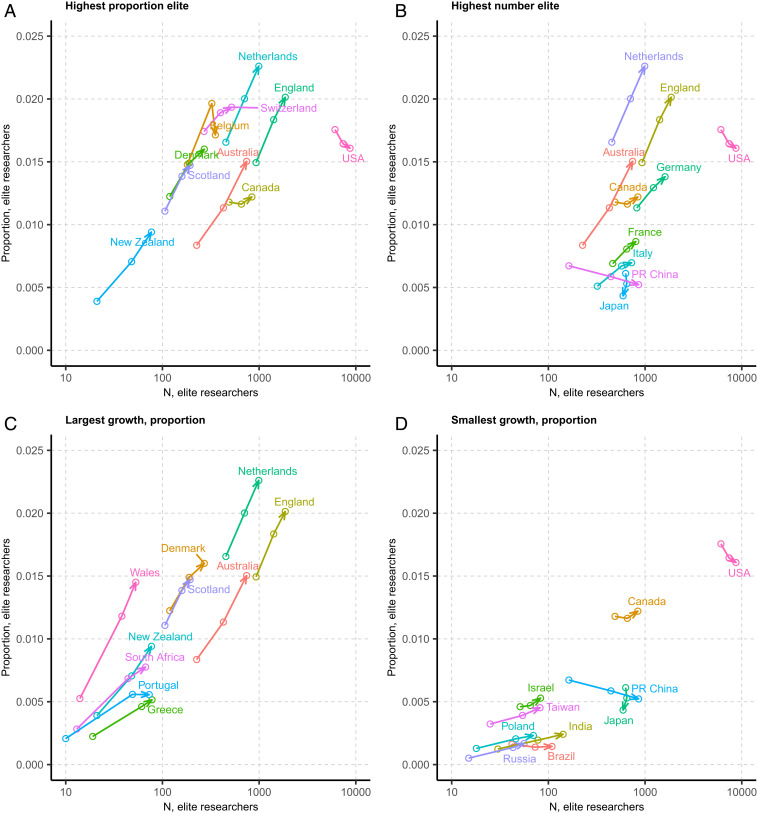
Fig. 5.
Country-level developments in the representation and concentration of elite researchers (i.e., the top 1% most cited) from 2000 to 2014, by 5-y increments. (A) Changes in elite concentration within the 10 countries with the highest proportion of top-cited scientists overall. (B) Changes in elite concentration within the 10 countries with the highest number of top-cited scientists overall. (C) Developments in elite concentration within the 10 countries with the largest growth in proportions of elite scientists. (D) Developments in elite concentration within the 10 countries with the smallest growth or largest declines in proportions of elite scientists. Trends are plotted by 5-y increments in all panels (2000–2004, 2005–2009, 2010–2014). The arrows indicate the direction of the development over time. Only countries with at least 2,000 disambiguated authors and at least 30 elite researchers are included in the figure.

