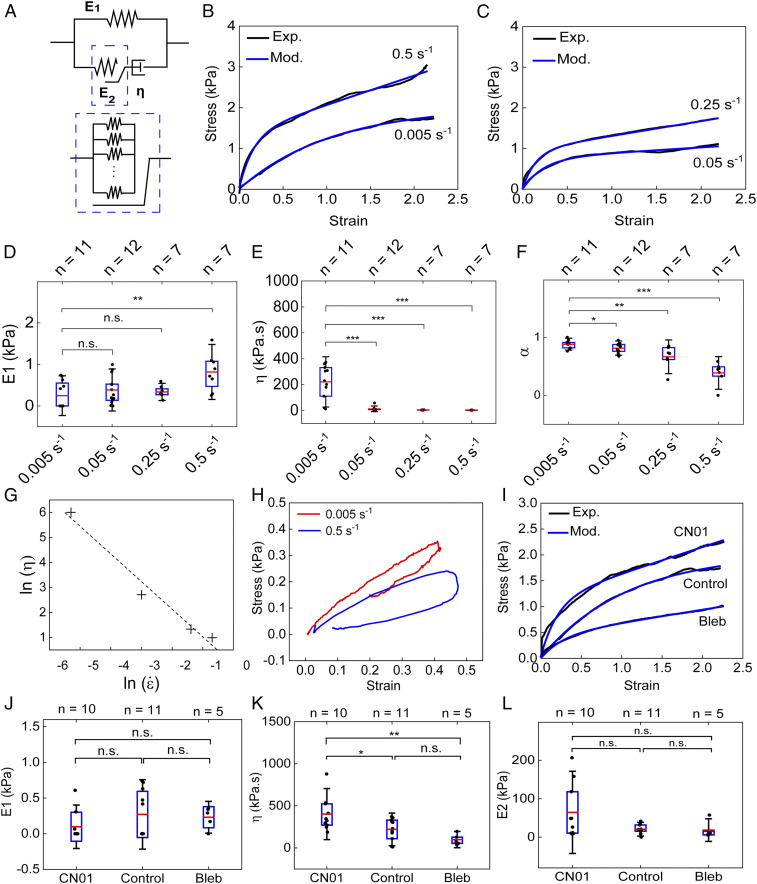
Fig. 4.
Strain-rate–dependent and actomyosin-contractility–controlled viscoelastic behavior of the cell pair. (A) Diagram of the modified standard linear solid (MSLS) model that was used for fitting the experimental data. (B, C) The stress–strain curves obtained by applying stretch at different strain rates (0.005 s−1, 0.5 s−1, 0.25 s−1, and 0.50 s−1) were fitted using Eq. 4 according to the MSLS model. (D–F) Box plots comparing the values of E1 (D), η (E), and α (F) obtained from fitting the stress–strain curves using Eq. 4 for different strain rates. (G) The predicted viscosity is plotted with respect to the strain rates in a log–log scale. (H) Hysteresis analysis is shown by recording the stress–strain relationship following a full cycle of application and release of tensile load on a cell pair at two strain rates (0.005 s−1 and 0.50 s−1). (I) The stress–strain curves obtained by stretching cells treated with CN01, Bleb, and DMSO control at a rate of 0.005 s−1 are fitted using Eq. 4. (J–L) Box plots comparing the values of E1 (J), η (K), and E2 (L) obtained from fitting the stress–strain curves for cells treated with CN01 and Bleb using Eq. 4. For each box plot, the number of experiments is indicated on top of each graph. *P < 0.05, **P < 0.01, ***P < 0.001.

